AI-built apps break in ways that traditional apps don't. There's no error handling around the edge case nobody mentioned in the prompt. The database query that works fine under light load silently times out at 3 AM when nobody is watching. Your users find out before you do, and by then they've already churned.
Monitoring fixes this. Not the enterprise kind with a six-figure contract. The pragmatic kind: one uptime check, one error tracker, one alert channel. That stack costs nothing to start and scales to millions of users before you need to spend real money. 92% of US developers now use AI coding tools daily; the code ships faster, but production hardening still requires human judgment. This tutorial covers that judgment.
Why AI-Built Apps Are Especially Prone to Silent Failures
When you write code by hand, you think about failure modes. You add a try-catch because you remember the last time that API returned a 503. AI writes the happy path. It builds what you described in the prompt, and it works when everything goes right. What it skips: the error state when the payment processor is down, the fallback when a third-party API rate limits you, the timeout when a database query takes 30 seconds.
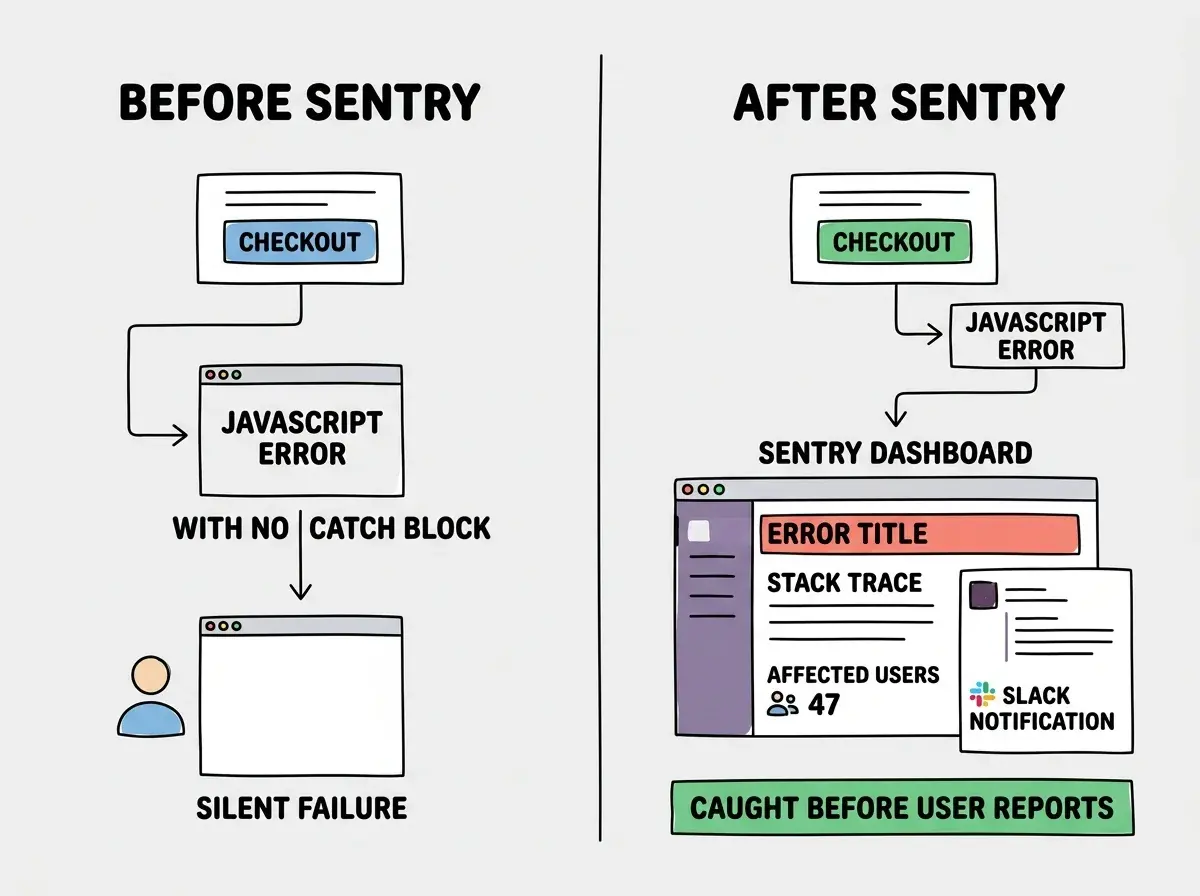
No error handling means no error. The function fails quietly. The user sees a loading spinner forever or a blank page with no trail to follow. No trail means no alert. No alert means you find out from a DM or a bad review.
The fix is external monitoring that doesn't care what your code handles. It pings your app from outside and tells you when it stops responding.
The Three-Layer Monitoring Stack
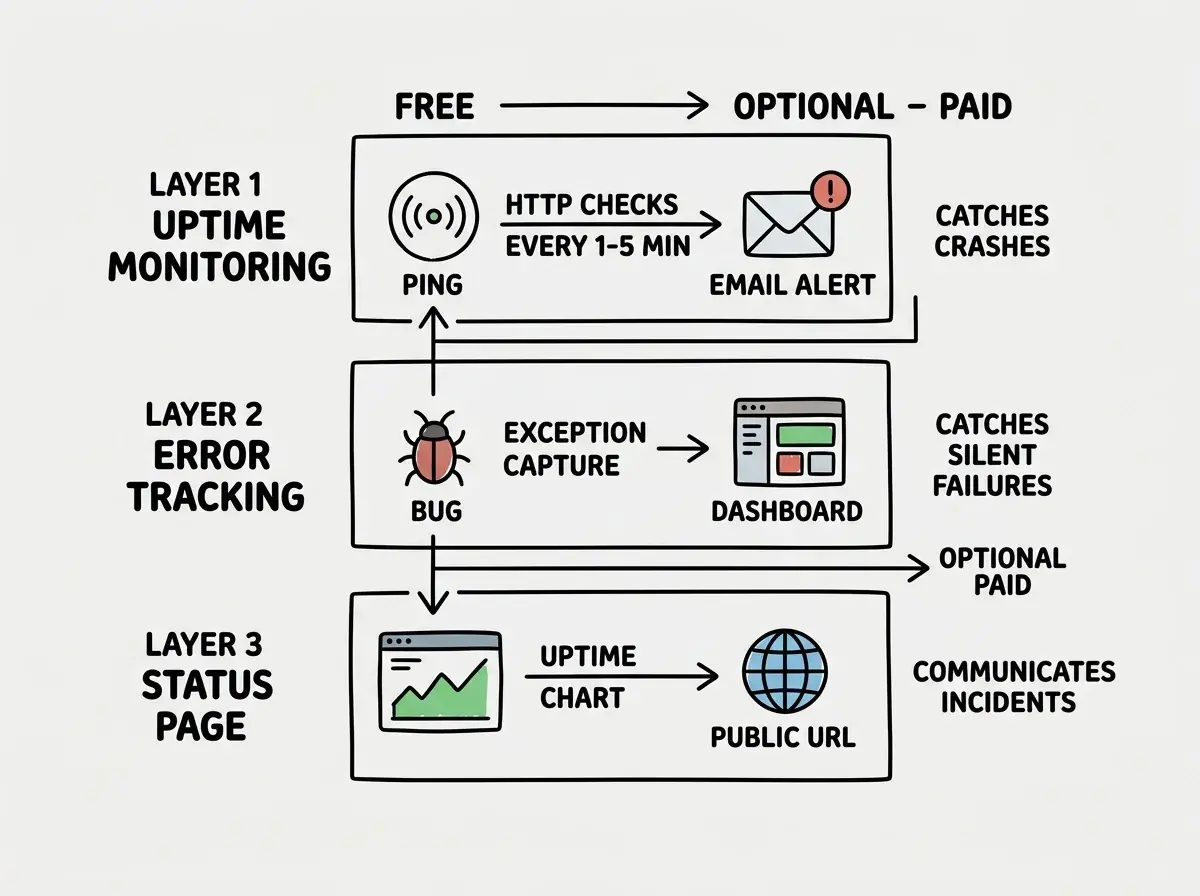
Good monitoring for an indie app has three layers, each catching failures the others miss.
Layer 1: Uptime monitoring. External checks that ping your URL every few minutes and alert you when it stops responding. This catches the 90% case: crashed server, broken deploy, expired domain, unpaid hosting bill.
Layer 2: Error tracking. Code-level instrumentation that captures unhandled exceptions with context (user ID, request path, stack trace) and surfaces them in a dashboard. This catches silent failures that uptime monitoring never sees.
Layer 3: Status pages. A public page showing uptime history for your users. When something breaks, they check the status page before filing a support ticket. A page that shows "investigating incident" signals you're on it.
Start with Layer 1 on day one. Add Layer 2 when you have real users. Add Layer 3 when you start getting "is the site down?" messages.
Uptime Monitoring Tool Comparison
Three tools worth knowing, each serving a different stage of growth.
UptimeRobot (free) monitors 50 URLs at 5-minute intervals with email and Slack alerts. Right starting point for every solo project. The catch: a failure can go 10 minutes before you know (one check to miss, one to confirm). That's acceptable at a few hundred users.
Better Stack starts at $0 for limited usage and $24/month for serious monitoring. You get 30-second intervals, multi-region checks, polished status pages, and incident timelines. The upgrade when UptimeRobot's delay stops feeling acceptable.
PagerDuty starts at $21/user/month and is built for on-call rotations. It has escalation policies, integrations with everything, and post-mortem tooling. Overkill for a solo founder; essential for a team with SLA commitments.
Decision tree: solo project under 1,000 users, UptimeRobot free. Growing app with paying customers, Better Stack. Team with engineers and on-call schedules, PagerDuty.
Setting Up UptimeRobot in 10 Minutes
Create an account at uptimerobot.com (no credit card required). Click "Add New Monitor," set the type to "HTTP(s)," enter your production URL, and set the interval to 5 minutes. Before saving, go to "My Alert Contacts," add your email, and attach it to the monitor. UptimeRobot doesn't alert anyone by default.
Add monitors for each critical URL: your homepage, your API health endpoint, and your login page. Each monitor is independent; one slow page doesn't mask a broken API.
The free tier gives you 50 monitors with email alerts. The paid tier ($7/month) adds SMS, 1-minute intervals, and status pages. Most indie apps run on the free tier for years.
Add a dedicated health endpoint to your app at /api/health or /health. Have it return {"status": "ok"} with a 200 status code. Monitor that endpoint, not just your homepage. A health endpoint confirms your server is running and can serve requests. Your homepage might return a cached 200 even when your database is down; a health endpoint that checks the database connection will catch that.
Setting Up Better Stack for Growing Apps
Better Stack combines uptime monitoring, log management, and status pages in one place. The setup takes 15 minutes.
Sign up at betterstack.com. In the Uptime section, create your first monitor. Better Stack supports HTTP checks, keyword checks (verify a specific word appears in the response body), and TCP checks for non-HTTP services.
Set the check interval to 30 seconds and configure multi-region checks across at least US East, US West, and Europe. If your app is down in one region but responding in others, it's a regional infrastructure issue, not your code. Better Stack surfaces that distinction automatically.
Connect alerts to Slack (requires paid plan) or email. Build a status page by adding your monitors and publishing to a subdomain. The page automatically shows uptime history for the last 90 days; post incident updates through the dashboard and they appear in real time.
Error Tracking With Sentry
Sentry is the standard for error tracking. The free tier covers 5,000 errors per month and stores 30 days of history, which is enough for most indie apps to run indefinitely without paying.
Install the SDK with npm install @sentry/nextjs, then run npx @sentry/wizard@latest -i nextjs. The wizard configures your next.config.js, creates the config files, and wires up your DSN. Under 10 minutes.
After installation, every unhandled exception gets captured automatically with stack trace, URL, browser, and affected user. Let it run for 48 hours before checking results. You will almost certainly find errors you didn't know existed: functions throwing exceptions that were silently swallowed, API calls failing with non-200 responses that the calling code never checked. That's the silent failure problem made visible.
Configuring Alerts That Actually Reach You
Monitoring is useless if the alerts go to an inbox you check once a week. Configure alerts for the channel you actually watch.
For UptimeRobot: Add a Slack integration in your alert contacts. Generate a Slack webhook URL (Apps, Incoming Webhooks, choose channel, copy URL) and paste it into UptimeRobot. Downtime alerts now go to Slack instead of an inbox you check twice a day.
For Sentry: In Project Settings, Alerts, create two rules: trigger when "An issue is first seen," and trigger when "An issue affects more than 10 users." The second rule prevents alert fatigue from low-severity errors nobody is hitting. Route both to Slack.
For PagerDuty: Create a service, add your monitoring tools as integrations (UptimeRobot and Better Stack both support it), set up an on-call schedule, and configure escalation steps. If the primary on-call doesn't acknowledge in 15 minutes, page the secondary.
Alert fatigue kills monitoring. Page immediately for downtime, notify in Slack for new error types, and send a weekly digest for trends. Reserve interruptions for things that require immediate action.
Only monitoring the homepage. Your homepage might return a cached 200 even when your checkout flow is broken, your API is timing out, or your authentication is failing. Monitor the URLs that represent real user value: the login endpoint, the API root, the payment page, the dashboard. Five monitors covering critical paths catch far more failures than one monitor on the homepage.
What to Monitor in AI-Built Apps Specifically
Standard monitoring checks whether your server is responding. AI-built apps need three additional checks.
Third-party API dependencies. If your app calls OpenAI, Stripe, or Twilio and that API goes down, an uptime check shows your app as healthy while it silently fails for every user. Add keyword checks (Better Stack supports this) that verify expected content appears in responses. Missing content means something upstream is broken.
Background jobs. Jobs for sending emails, processing uploads, or running AI inference have no URL to check. Monitor them with heartbeats: each job writes a "last completed at" timestamp, and you alert if it's stale. Better Stack and Cronitor both support heartbeat monitoring.
Database connections. AI-built apps frequently don't configure connection limits. Under load, the pool exhausts and the app hangs. Your /api/health endpoint should run a SELECT 1 and time it. Two seconds instead of two milliseconds means your pool is gone.
Free vs. Paid at Each Stage
Here's the practical cost breakdown: pre-launch with zero users, UptimeRobot free plus Sentry free covers everything at $0. Early traction (1-500 users) adds UptimeRobot's paid plan at $7/month for status pages and faster checks. Growing apps (500-5,000 users) upgrade to Better Stack at $24/month for 30-second multi-region checks. Teams with on-call commitments add PagerDuty, bringing the total to $70-150/month. At that scale, downtime costs more per minute than the monthly monitoring bill.
Get the full post-deploy checklist to pair with your monitoring setup.
See the deployment checklistThe 30-Minute Setup Checklist
- Create a UptimeRobot account. Add monitors for your homepage,
/api/health, and your most critical page. Add email as an alert contact. (5 minutes) - Add a
/api/healthendpoint that returns{"status": "ok", "db": "ok"}after checking your database connection. (10 minutes) - Install Sentry with the wizard. Deploy, then confirm errors appear in the dashboard. (10 minutes)
- Add a Slack webhook to UptimeRobot and Sentry. Route alerts to
#prod-alerts. (5 minutes)
That's it. You know when your app goes down, you capture every unhandled exception, and alerts reach you where you actually look. The stack costs nothing until you're growing fast enough that downtime has a real price tag.
Monitoring isn't the exciting part. It's the part that determines whether what you built survives contact with real users.
Dig deeper
A few hand-picked sources if you want to go further.
Monitoring is one piece. See the complete production-readiness checklist for AI-built apps.
Get the full checklist