92% of US developers use AI tools daily. Most of them have never configured log rotation. The two facts are directly connected.
When an AI coding tool builds a Node.js application, the default logging strategy is console.log. It works during development. It requires zero configuration. And it leaves you completely blind in production while simultaneously growing your disk usage at a rate that compounds until something breaks. The AI is not making a mistake here. It is generating code that works for the immediate task. Long-term log management is outside the scope of the feature prompt.
The failure mode is predictable. A vibe-coded app ships with unbounded console output. On a $6 Hetzner VPS or a $7 DigitalOcean droplet, the root filesystem is typically 25 to 40 GB. Six months of unrotated application logs from a moderately active app routinely fill that disk. When the disk fills, the app stops. Not gracefully with an error page. It stops accepting writes, which means the database goes down, the API returns 500s, and your first notification is a user email rather than an alert. The disk fills slowly, then all at once.
This article gives you the specific steps to fix that. Structured logging with Pino, log rotation with logrotate, retention policies, and shipping to an external log service without breaking your infrastructure budget.
Why Console.log Is a Production Problem
The issue with console.log in production is not just the lack of rotation. Three separate problems compound each other.
No structure means no searchability. When your app throws an error at 2 AM, you want to query for all log lines related to a specific user ID, request ID, or error code. Console output is unstructured text. Searching it at scale requires grep, which is slow and fragile. Every minute you spend manually parsing log files is a minute the incident is still open.
No log levels means no filtering. In development, logging everything is fine. In production, verbose debug output from a high-traffic endpoint can generate gigabytes of data per day. Without log levels, you cannot tell the logging library to be quiet about routine events while staying loud about errors. Everything gets written, always.
No rotation means unbounded growth. Node.js process stdout goes to systemd journal or a flat file depending on your deployment setup. Neither has a default size limit that will protect your disk. Without logrotate or an equivalent, the file grows until you intervene manually or run out of space.
The fix for all three is structured logging with Pino, combined with either logrotate for self-hosted deployments or a log shipping agent for cloud environments.
Setting Up Pino for Structured Logging
Pino is the fastest structured logging library for Node.js and the recommended choice for production apps. It writes newline-delimited JSON, which is queryable, parseable, and compatible with every major log aggregation service.
Install it:
npm install pino pino-pretty
Replace your top-level logger setup with a Pino instance:
import pino from 'pino';

export const logger = pino({
  level: process.env.LOG_LEVEL || 'info',
  ...(process.env.NODE_ENV !== 'production' && {
    transport: {
      target: 'pino-pretty',
      options: { colorize: true }
    }
  })
});
In production, this writes clean JSON to stdout. In development, pino-pretty formats it for human readability. You control verbosity with a single environment variable, which means you can turn on debug logging in production for a specific incident without redeploying.
Replace console.log calls throughout the codebase. The key difference is that Pino logs are objects, not strings:
// Before (AI-generated default)
console.log('User signed in:', userId);
console.error('Payment failed:', error.message);

// After (structured)
logger.info({ userId, event: 'user.signin' }, 'User signed in');
logger.error({ userId, error: error.message, code: error.code }, 'Payment failed');
The structured version lets you query event = "user.signin" across your log aggregator to pull all sign-in events for a time range. The unstructured version requires text parsing that breaks the moment the message format changes.
For Next.js apps on Vercel or Cloudflare, stdout goes directly to the platform's log infrastructure. You do not need logrotate in those environments. The platform manages retention. For self-hosted Node.js on a VPS, you need the rotation step.
Switch from console.log to Pino before your first 1,000 active users. The structured output pays off immediately when you are debugging an incident, and the performance difference matters at scale. Pino is roughly 5x faster than console.log at high log volumes because it serializes asynchronously rather than blocking the event loop.
Configuring Log Rotation with logrotate
On Linux VPS deployments (Hetzner, DigitalOcean, AWS EC2), logrotate is the standard tool for rotating log files. It is installed by default on Ubuntu and Debian.
First, configure your Node.js app to write to a file instead of stdout. The simplest approach is to redirect stdout when starting the process:
# In your systemd service file or startup script
node server.js >> /var/log/myapp/app.log 2>&1
Or use Pino's built-in file transport:
export const logger = pino(
  { level: process.env.LOG_LEVEL || 'info' },
  pino.destination('/var/log/myapp/app.log')
);
Then create a logrotate configuration at /etc/logrotate.d/myapp:
/var/log/myapp/*.log {
    daily
    rotate 14
    compress
    delaycompress
    missingok
    notifempty
    create 0640 www-data www-data
    postrotate
        kill -USR1 $(cat /var/run/myapp.pid 2>/dev/null) 2>/dev/null || true
    endscript
}
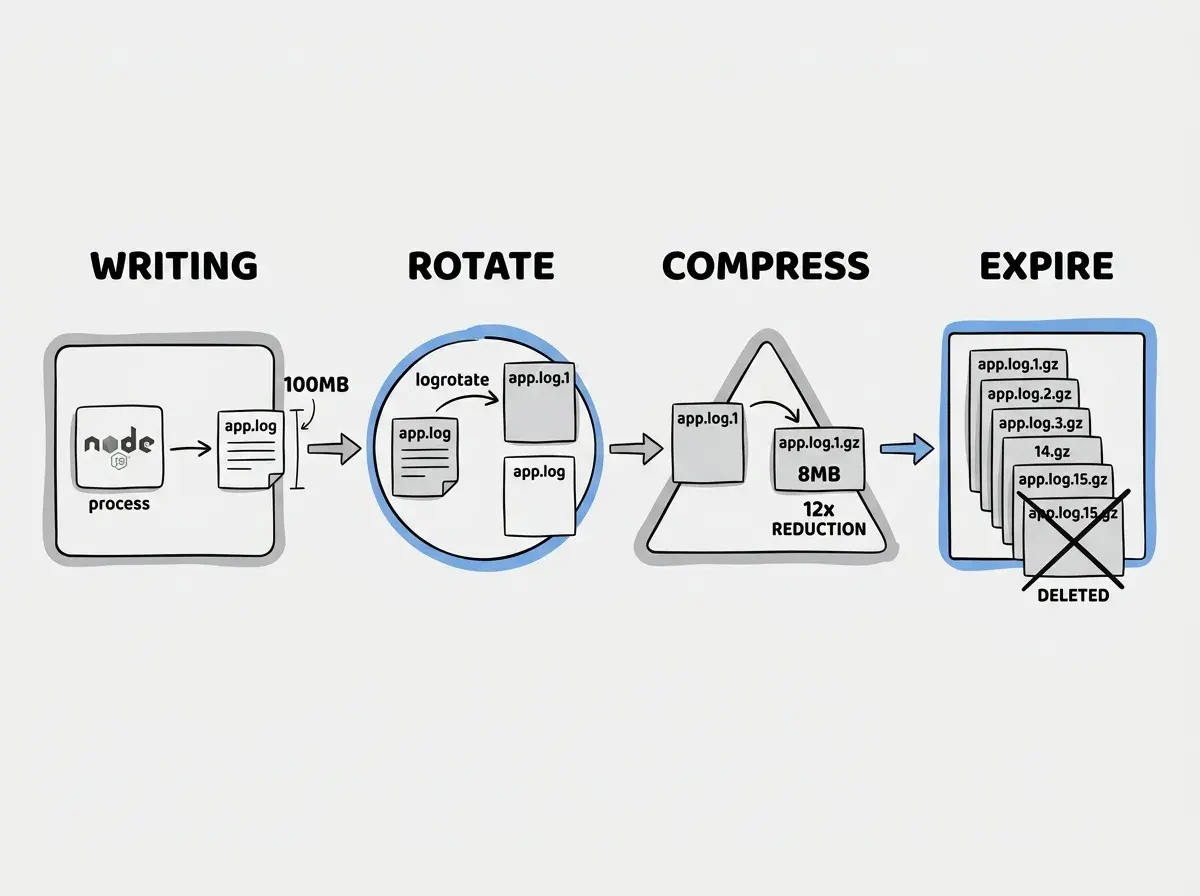
This configuration rotates logs daily, keeps 14 days of history, compresses rotated files (typically 10 to 20x size reduction), and sends a USR1 signal to your Node process after rotation so it reopens the log file descriptor. Without the postrotate signal, the process continues writing to the old inode even after logrotate moves the file.
Test the configuration without actually rotating:
logrotate --debug /etc/logrotate.d/myapp
For most small to medium apps, a 14-day rotation window with compression keeps disk usage under 500 MB even at moderate log volumes. Adjust rotate based on your disk size and how far back you realistically need to look during incident investigation.
Log Retention Policies
Rotation without a retention policy just trades one problem for another. You need to define how long logs are kept before deletion, and that decision is not purely technical.
For most apps, 14 to 30 days of application logs is sufficient for operational debugging. Incidents are almost always diagnosed within 48 to 72 hours. Logs older than two weeks are rarely consulted except for compliance reasons. If you do not have a compliance requirement driving longer retention, 14 days is the right default because it keeps your storage footprint predictable.
Access logs (HTTP request logs) are a different category. They are high-volume and often required for security investigations or billing disputes. A reasonable policy is 30 days hot (on disk or in your log aggregator) and 90 days cold (in object storage). At $0.015 per GB per month on Cloudflare R2 or S3 Glacier, archiving 3 to 6 months of compressed access logs costs less than $2 per month for most small apps.
Error logs deserve the longest retention window. Errors that correlate with specific events, deploys, or user cohorts are genuinely useful beyond 30 days. Ship your error-level logs to an error tracking service like Sentry, which keeps them indefinitely at the event level, rather than relying on flat file retention.
Define your retention policy before your first significant traffic spike, not during one. A log file that fills your disk during a traffic spike is the worst possible time to be making policy decisions under pressure.
Shipping Logs to an External Service
For any app generating more than a few thousand requests per day, shipping logs to an external aggregation service is worth the cost. The operational benefits outweigh the price at almost every traffic level.
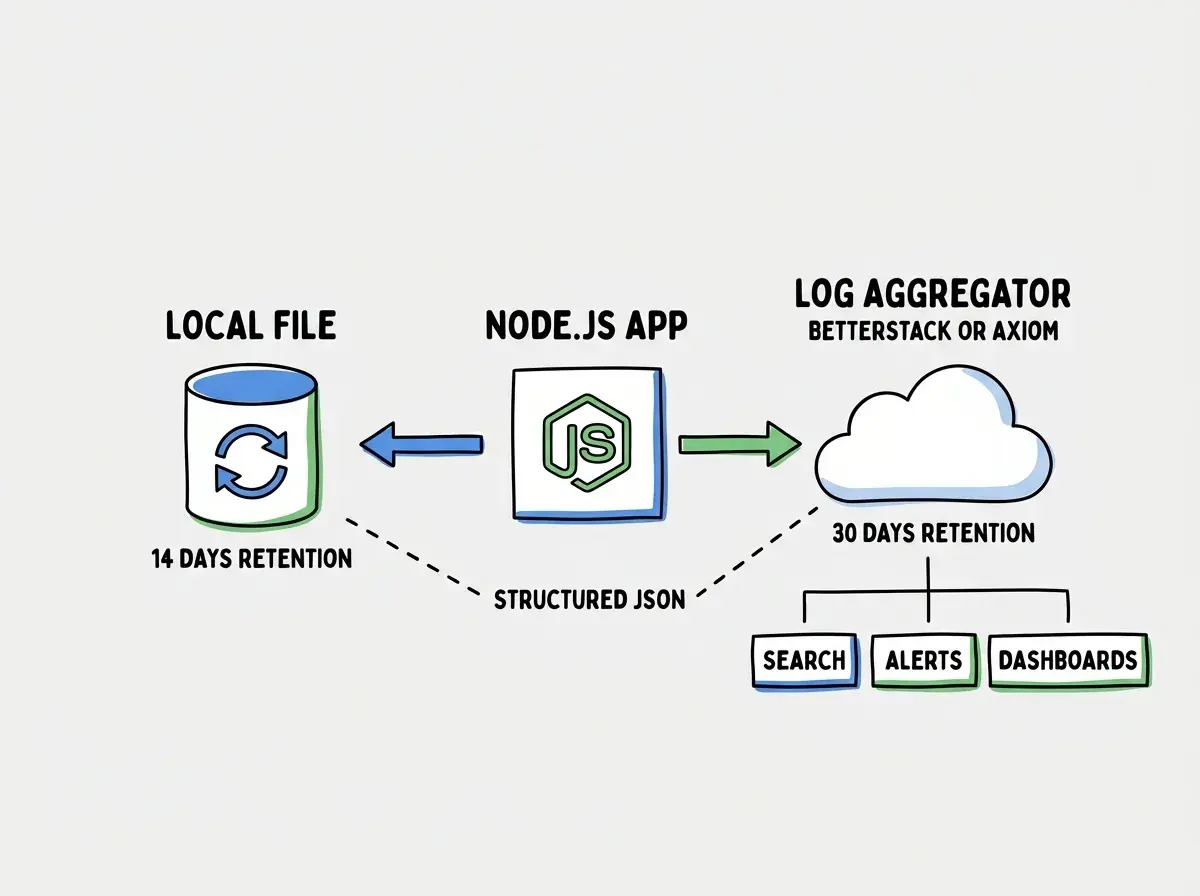
BetterStack Logs (formerly Logtail) is the best starting point for vibe-coded apps. The free tier includes 1 GB per month with 3-day retention, which covers development and early production. Paid plans start at $25 per month for 10 GB with 30-day retention. Axiom is the alternative with a more generous free tier (500 MB per day, 30-day retention) and a query interface that is more powerful for structured log analysis.
Shipping from a Node.js app with Pino takes about ten lines of code:
import pino from 'pino';

export const logger = pino({
  level: process.env.LOG_LEVEL || 'info',
  transport: {
    targets: [
      // Local file for backup
      {
        target: 'pino/file',
        options: { destination: '/var/log/myapp/app.log' }
      },
      // BetterStack for aggregation
      {
        target: '@logtail/pino',
        options: { sourceToken: process.env.BETTERSTACK_SOURCE_TOKEN }
      }
    ]
  }
});
Install the BetterStack transport:
npm install @logtail/pino
With this setup, every structured log line goes to both your local file (for immediate disk access) and BetterStack (for search, alerting, and retention). You can then query across all your logs in BetterStack's UI using the structured fields you defined with Pino, set up alerts for error spikes, and build dashboards without touching the server.
Storage Cost Estimates
Log costs are easy to ignore because they scale slowly. Then they do not.
A moderately active app generating 500 HTTP requests per minute with Pino logging at info level produces roughly 5 to 10 KB of log data per second. That is 400 to 800 MB per day uncompressed. With logrotate compression at 12 to 15x, the daily compressed footprint is 25 to 65 MB. Over 14 days that is 350 MB to 900 MB, well within the range of a standard VPS disk allocation without affecting app performance.
At 5,000 requests per minute (a modest traffic spike), the same math produces 3.5 to 9 GB per day uncompressed. At that volume, log rotation configuration becomes critical within hours. Compression handles the math, but you need rotation running before you hit that traffic level, not after.
The cloud cost picture is simpler. On Vercel, logs are retained for 24 hours on the Hobby tier and 7 days on Pro. If you need longer retention you ship to an external service. On Cloudflare Workers, logs go to Cloudflare's logpush if configured, or disappear into the void otherwise. Neither platform bills you for log storage because neither stores it by default. The cost is in the external aggregation service you choose.
For a small app spending $50 to $100 per month on infrastructure, a log aggregator in the $0 to $25 per month range is the right budget. BetterStack or Axiom's free tiers cover you until you need more than 1 GB per day of log ingestion.
The Log Hygiene Routine
Log management is not a one-time setup. Three recurring checks keep it healthy.
Weekly. Check your disk usage on self-hosted deployments. df -h on the root filesystem. If logs are growing unexpectedly, identify which process is writing more than expected and whether your logrotate configuration is running correctly. logrotate --status /etc/logrotate.d/myapp shows the last time each log was rotated.
Monthly. Review log volume in your external aggregator and compare against the previous month. A sudden increase in log volume is often the first signal of a bug generating unexpected errors, a traffic spike, or a misconfigured retry loop hammering an endpoint. Catching it in log volume before it shows up in infrastructure costs saves money and prevents surprises.
On every deploy. Confirm your LOG_LEVEL environment variable is set correctly. AI coding tools sometimes add verbose debug logging while solving a specific problem and leave it enabled. An unintentional LOG_LEVEL=debug in production can increase log volume by 10x within an hour of a deploy.
Setting LOG_LEVEL=debug in production to investigate a specific incident and forgetting to change it back. Debug logging on a high-traffic endpoint can fill a disk or exhaust your log aggregator's monthly quota within hours. Always set log level changes as temporary and put a calendar reminder to revert them, or use a feature flag system that automatically reverts after a time window.
Moving from console.log Without Breaking Everything
If your app is already in production with console.log everywhere, the migration path is incremental. You do not need to replace all logging at once.
Start at the infrastructure layer. Install Pino, create the logger instance, and replace logging in your middleware and error handlers first. These two places generate the most log volume and benefit most from structured output. Your request logging middleware should capture method, URL, status code, response time, and user ID in a single structured line per request. Your global error handler should log the full error object plus whatever context is available.
Week two, replace logging in your API route handlers. These are high-value because they are where most debugging happens. Week three, replace logging in your background jobs and scheduled tasks, which often have the least visibility and benefit most from structured output.
Leave console.log calls in utility functions and library code until they cause a problem. A half-migrated codebase is still much better than no migration. Every module that produces structured logs is searchable in your aggregator, even if other modules still write unstructured text.
The goal is a production logging setup where you can answer four questions without SSH access to the server. Is the app healthy right now? What happened in the 30 minutes before an error? Which user triggered the error? Is this error new or recurring? Structured logging with Pino plus any external aggregator gives you all four. Console.log gives you none.
Logging is one part of the operational picture. The S15 Maintenance Handbook covers the full routine for keeping AI-built apps healthy long-term.
Browse the Maintenance HandbookQuick Reference
Install Pino:
npm install pino pino-pretty
Create logger:
import pino from 'pino';
export const logger = pino({ level: process.env.LOG_LEVEL || 'info' });
logrotate config location: /etc/logrotate.d/yourapp
Key settings: daily, rotate 14, compress, delaycompress
Check rotation status: logrotate --status /etc/logrotate.d/yourapp
Check disk usage: df -h and du -sh /var/log/yourapp/
Free log aggregators: BetterStack (1 GB/month, 3-day retention), Axiom (500 MB/day, 30-day retention)
The 92% of developers using AI daily are mostly not configuring log rotation. That is the gap. The configuration takes about two hours on a first pass. The disk crisis it prevents takes days to recover from and tends to happen during peak traffic when you can least afford it.
Dependencies, database vacuuming, security patches, and now logs. The complete S15 Maintenance Handbook series has every routine.
Read more