Analytics is the practice of measuring what users do in your app so you can make informed decisions about what to build, fix, or change. Without analytics, every product decision is a guess. With analytics, you have evidence.
If you have ever launched a feature and wondered whether anyone actually used it, or spent weeks building something that felt important but had no way to prove it, analytics is the answer to those questions.
A Fitness Tracker for Your App
Think of analytics as a fitness tracker for your app. A fitness tracker sits on your wrist and quietly records everything: steps taken, heart rate, sleep quality, calories burned. You do not feel it working, but at the end of the day, it gives you a clear picture of what happened.
Without a fitness tracker, you might say "I was pretty active today." With one, you know you walked 4,200 steps, which is less than your 8,000-step goal. That specificity changes behavior. You might take an evening walk to close the gap. You would not have done that based on a vague feeling of being "pretty active."
Analytics works the same way for your app. Without it, you might say "the app seems to be doing well." With it, you know that 340 people visited your landing page, 28 signed up, 12 completed onboarding, and 3 converted to paid users. Those numbers tell a story that feelings cannot. And that story tells you exactly where to focus your energy.
Steps Taken (Pageviews and Sessions)
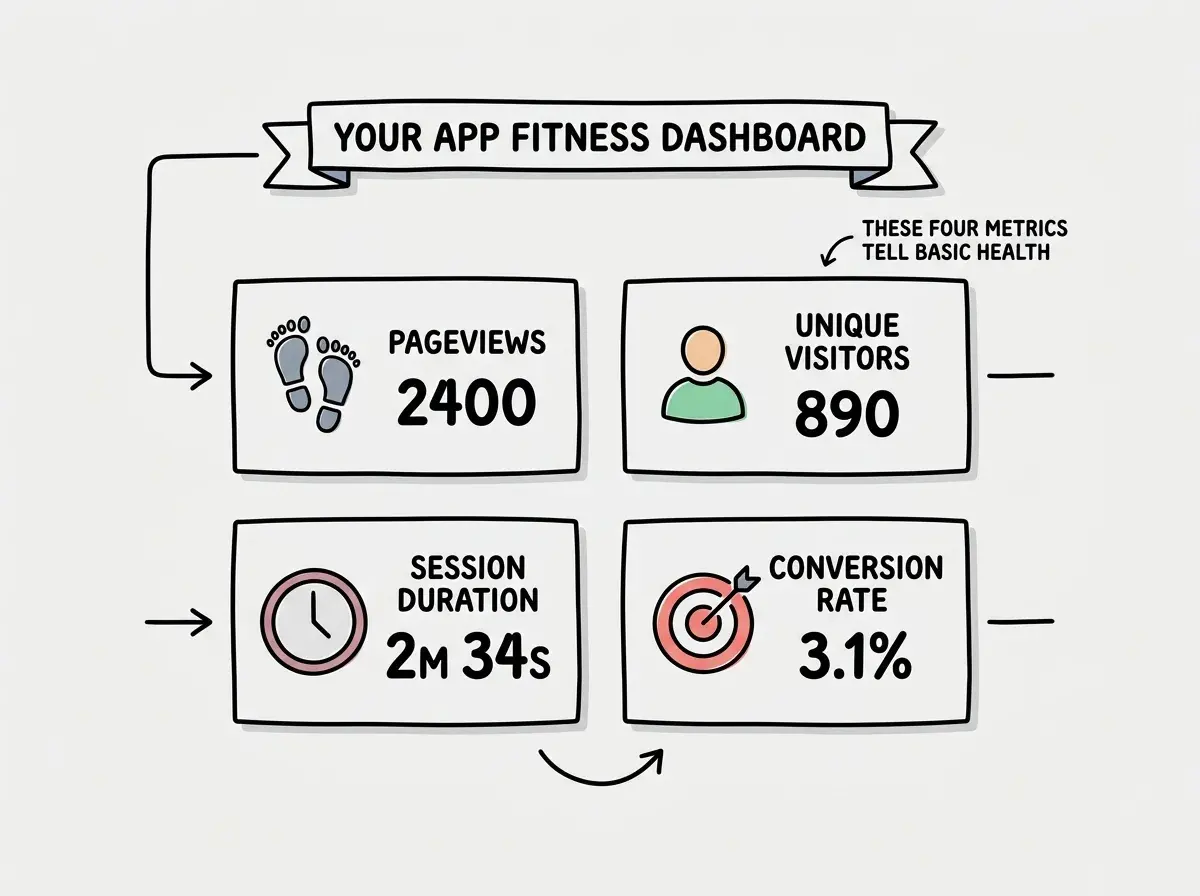
The most basic measurement on a fitness tracker is step count. In analytics, the equivalent is pageviews and sessions.
A pageview is recorded every time someone loads a page in your app. It is the simplest possible measurement: someone was here. A session groups multiple pageviews together into a single visit. If someone lands on your homepage, clicks to your pricing page, and then reads your blog, that is one session with three pageviews.
This confuses everyone at first because pageviews sound more impressive than they are. If one person refreshes your homepage ten times, that is ten pageviews but one session from one user. The distinction matters because pageviews measure activity while sessions and unique visitors measure actual people.
The fitness tracker equivalent is steps versus walks. Eight thousand steps during one long walk tells a different story than the same steps spread across four short ones.
Heart Rate (Events and User Actions)
Step count tells you someone moved. Heart rate tells you how hard they worked. In analytics, events are your heart rate monitor. They track specific actions: a user clicked the signup button, submitted a form, watched a video, added an item to their cart, or completed a purchase.
Events give you depth that pageviews cannot. Knowing that 500 people visited your pricing page is useful. Knowing that 500 people visited your pricing page, 120 clicked "Start Free Trial," and only 40 actually completed the signup form is actionable. That gap between 120 clicks and 40 completions tells you the signup form has a problem. You would never see that from pageviews alone.
You might think you need to track every possible action from the start. But actually, tracking too many events creates noise that makes the data harder to interpret. Start with the five to ten actions that directly relate to your app's purpose, and expand from there.
For a SaaS product, those core events might be: signed up, completed onboarding, created first project, invited a team member, and upgraded to paid. For an e-commerce site: viewed product, added to cart, started checkout, and completed purchase. Each of these represents a step in the journey that matters.
Your Goal Weight (Conversion Tracking)
A fitness tracker is most useful when you set goals. Walk 10,000 steps. Sleep seven hours. Burn 500 calories. Without goals, the data is interesting but not motivating. With goals, every measurement becomes a progress report.
Conversion tracking is goal-setting for your app. A conversion is any action you want users to take: signing up, making a purchase, subscribing to a newsletter, booking a demo. The conversion rate is the percentage of visitors who actually do that thing.
If 1,000 people visit your landing page and 30 sign up, your conversion rate is 3%. That number is now your baseline. Every change you make to the landing page can be measured against it. New headline? Did the rate go up or down? Different button color? Check the number. Shorter signup form? Measure the impact.
This is where analytics transforms from a reporting tool into a decision-making tool. You stop debating whether the blue button or the green button is better and let the data settle the argument.
Analytics is not about collecting data for its own sake. It is about answering specific questions. Is my landing page converting visitors to signups? Where do users drop off in my onboarding flow? Which features are people actually using? Start with the questions that matter most to your business, then set up tracking to answer them. A few well-chosen metrics are worth more than a dashboard full of numbers nobody looks at.
The Best Analytics Tools for Vibe Coders
Just like there are different fitness trackers for different needs, there are different analytics tools for different priorities.
Google Analytics is the most widely used. Free and powerful, but complex. Google Analytics 4 has a steep learning curve and collects data that raises privacy questions. Think of it as the feature-packed smartwatch that does everything but takes a week to figure out.
Plausible is a privacy-focused alternative. Lightweight, no cookies, and a clean dashboard. Think of it as a minimalist step counter that does one thing beautifully.
PostHog goes deeper than either. Event tracking, session recordings, feature flags, and A/B testing. Open source with a generous free tier. Think of it as the medical-grade fitness tracker, ideal when you need detailed diagnostics.
For most vibe coders starting out, Plausible or PostHog is the right choice. Google Analytics is overkill for an early-stage project.
Analytics is one of the fundamentals that separates apps that improve from apps that stagnate.
Learn the basicsPrivacy and the Responsibility of Tracking
When you track what users do, you take on a responsibility. GDPR (in Europe) and similar privacy laws require you to inform users about what you track and, in many cases, get their consent. This is why cookie consent banners exist on most websites.
Privacy-focused tools like Plausible sidestep most of these concerns by design. They do not use cookies, do not track individuals across sessions, and do not collect personally identifiable information. You get aggregate data (200 people visited your pricing page) without individual tracking (John Smith from Chicago visited at 3:47 PM).
The balance is simple: track actions that help you build a better app. Do not track things you have no plan to use.
What to Track First
If analytics feels overwhelming, start small. Here are the five things worth measuring from day one, in order of priority.
Unique visitors. How many different people are coming to your app? This is your baseline for everything else.
Traffic sources. Where are those people coming from? Search engines, social media, direct links, referrals? This tells you which marketing efforts are working.
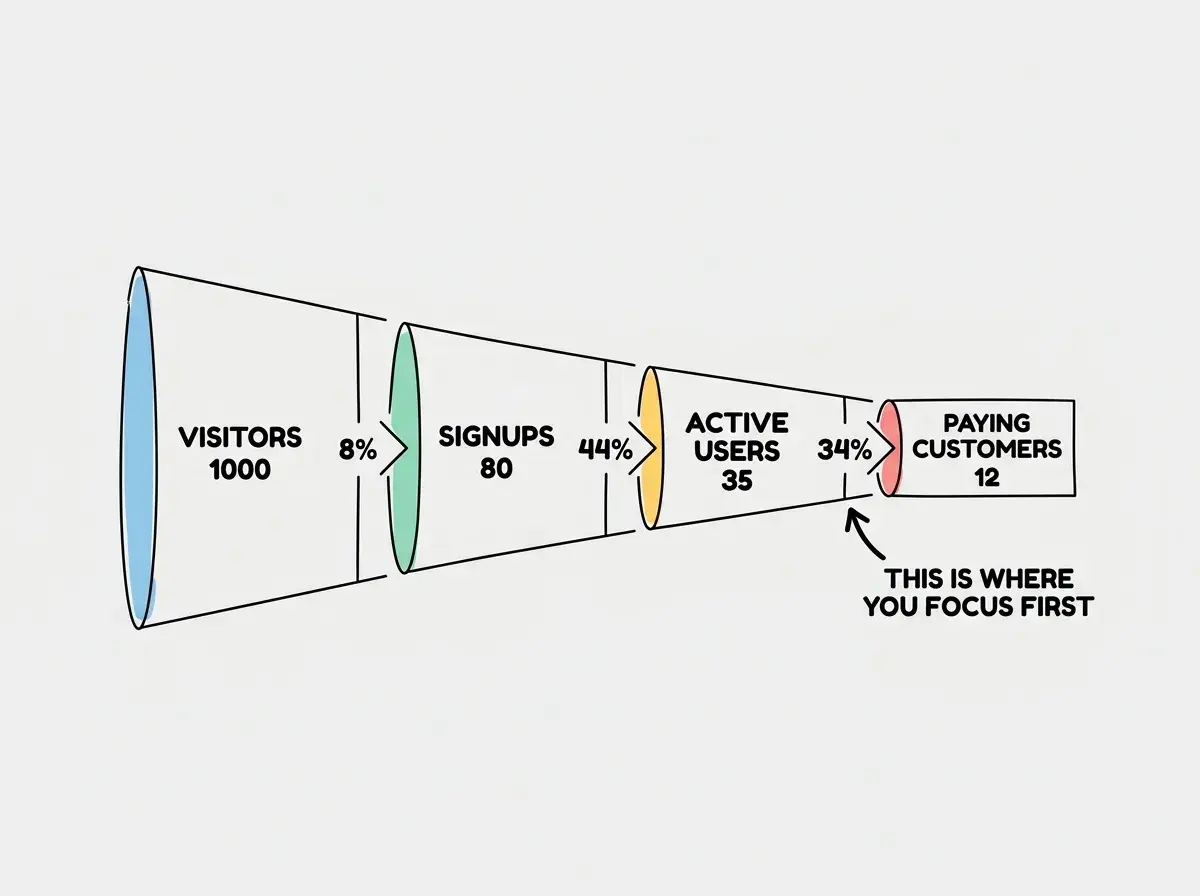
Core conversion event. Pick the single most important action in your app (signup, purchase, booking) and measure how many visitors take that action. This one number tells you whether your app is working.
Drop-off points. Where do people leave? If 80% of visitors who start your signup form abandon it halfway through, the form is the problem, not your marketing.
Feature usage. Which parts of your app do people actually use? This prevents you from investing weeks in features nobody touches while ignoring the features people love.
Adding analytics after you launch and then wondering why you have no baseline data. Set up analytics before your first user arrives, even if it is just a simple Plausible or PostHog script. You cannot improve what you did not measure, and you cannot measure retroactively. The data you wish you had from launch week is gone forever if you did not set up tracking in advance.
Dig deeper
A few hand-picked sources if you want to go further.
What This Means For You
Analytics is a fitness tracker for your app. It measures who comes, what they do, where they get stuck, and whether they accomplish the things you built the app for. Without it, you are guessing. With it, you are making decisions based on evidence. And just like a fitness tracker, the value is not in the data itself but in the habits it enables.
- If you are a founder building a product: Analytics is how you prove your product works, to yourself, to investors, and to your team. Set up conversion tracking for your most important user action before you launch. When someone asks "how is the product doing?" you want to answer with numbers, not feelings. This is the difference between a hobby project and a business.
- If you are a product manager or marketer: Analytics is your primary tool for prioritization. When stakeholders argue about what to build next, data settles the debate. Learn to read a conversion funnel, set up event tracking for key user actions, and build the habit of checking your analytics dashboard weekly. The patterns will tell you what to focus on.
- If you are a student learning to build: Adding analytics to your projects demonstrates product thinking, not just coding ability. It shows you care about whether your app actually works for users, not just whether it compiles. Employers and collaborators notice this. Set up Plausible on your next project. It takes five minutes and changes how you think about what you build.
Analytics is one piece of the puzzle. Learn the other fundamentals that help you build apps that actually work.
Explore more