Systematic debugging is a structured method of isolating bugs by eliminating half the possible causes with each step. Instead of guessing and clicking randomly, you apply a divide-and-conquer strategy borrowed from computer science. It sounds obvious. Almost nobody does it consistently when they are stressed and under pressure.
What Is Systematic Debugging
Random debugging looks like this: something breaks, you scan the code for anything suspicious, you comment out a few lines, you add a console.log, you change a variable name because maybe that was it, and after 45 minutes you still have no idea what is wrong. You are searching a haystack by picking up individual pieces of straw.
Systematic debugging looks different. You define the boundaries of the problem first. Then you split the suspect area in half and check which half contains the bug. You repeat this until the problem is contained to a single function, a single line, a single argument.
The key difference is that every action in systematic debugging gives you information you can act on. Every action in random debugging is a guess that might not tell you anything useful even if it works.
This matters more with AI tools in the picture. When you use Cursor or GitHub Copilot to write code, you often do not have deep intuition about every part of the system. The AI wrote it, it mostly works, then something breaks and you have almost no mental model of where to look. Systematic debugging is the approach that works even when you did not write the code yourself.
What Is Binary Search Debugging
Binary search is a classic algorithm for finding a value in a sorted list. Instead of scanning from the first element to the last, you check the middle element. If your target is smaller, you eliminate the upper half. If it is larger, you eliminate the lower half. Each check cuts the search space in half.
Applied to debugging, the principle is identical. Your codebase is the list. The bug is the value you are searching for. Instead of scanning every line from top to bottom, you cut the problem space in half with each test.
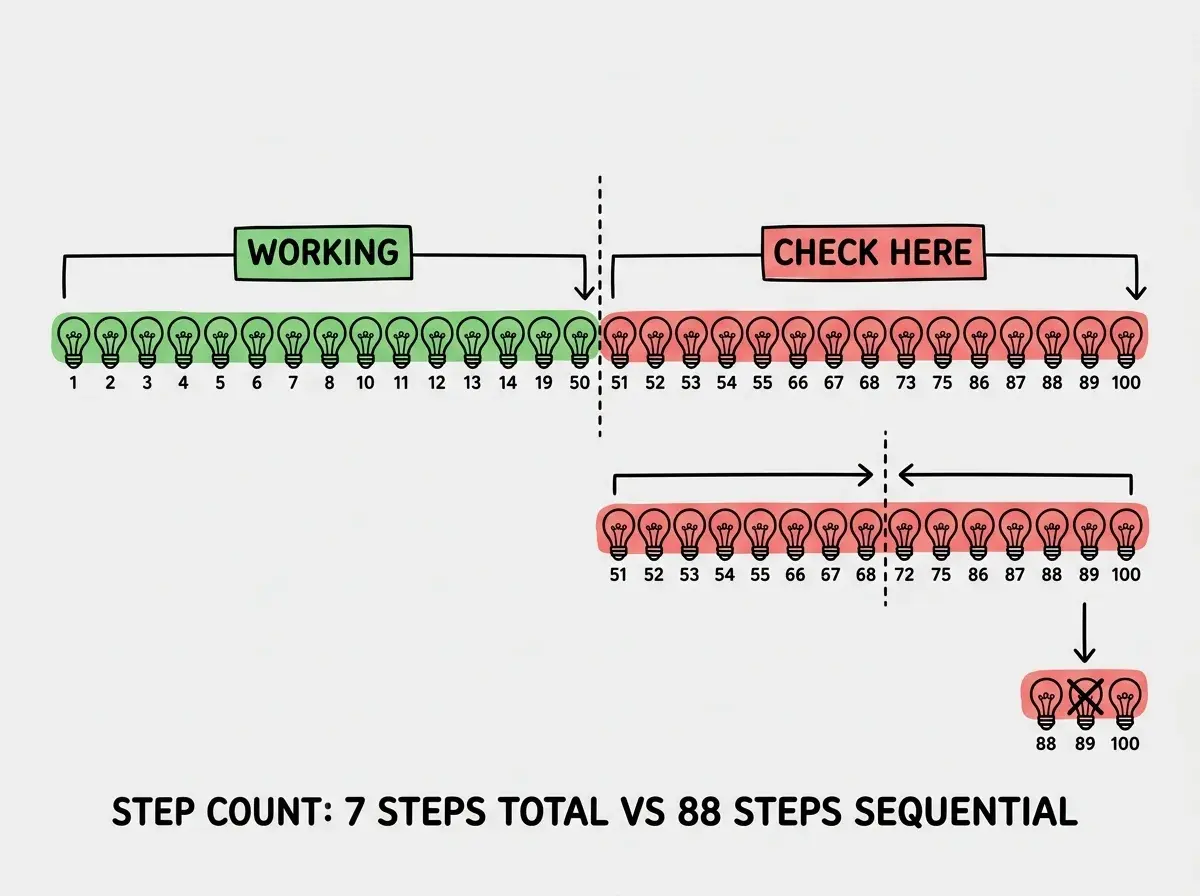
Here is the analogy that makes this concrete. Imagine you have a string of 100 Christmas lights. One section is not lighting up. You could test each bulb one by one starting from the left. That is at most 100 tests. Or you could unplug the string at the midpoint and test the left half. If the left half lights up, the problem is on the right. Now you only have 50 bulbs to check. Unplug at the midpoint of those 50. Test again. Now you have 25. After 7 steps (log base 2 of 100 is about 6.6) you have found the bad bulb. Same result. Fraction of the work.
What Is the First Step in a Systematic Approach to Debugging
The first step is always the same: define the boundaries. Before you touch any code, answer two questions. Where does correct behavior begin, and where does incorrect behavior show up?
This sounds trivial. It is not. Most developers skip it because they think they already know the answer. They are usually wrong, or at least imprecise. "The form is broken" is not a boundary. "The API returns a 200 but the UI shows an error message" is a boundary. Now you know the bug is somewhere between the API response and the error message render.
Once you have boundaries, you pick a midpoint. In a request-response cycle, the midpoint might be the function that parses the API response. You log the raw response at that midpoint. If the parsed data looks correct there, the bug is in the rendering layer. If it does not, the bug is in the network layer or the API itself. You have just cut the problem in half without touching a single line of actual code.
Here is what this looks like in practice. Suppose a user form submission is failing silently. The form appears to submit, the page does not change, and nothing shows up in the database.
// Step 1: Confirm the boundary
// Where does it break? Add a log at the outermost point.
async function handleSubmit(formData) {
  console.log("handleSubmit called", formData); // Does this fire?
  const result = await submitToAPI(formData);
  console.log("API result", result); // Does this fire?
  updateUI(result);
}
If "handleSubmit called" never appears in the console, the problem is in the event binding, not the submit logic. You have just eliminated half the codebase as suspects. If it does appear but "API result" never does, the problem is inside submitToAPI. Again, half the code is eliminated.
// Step 2: Bisect submitToAPI
async function submitToAPI(formData) {
  console.log("submitToAPI called"); // Does this fire?
  const payload = formatPayload(formData);
  console.log("payload", payload); // Correct shape?
  const response = await fetch("/api/submit", {
    method: "POST",
    body: JSON.stringify(payload),
  });
  console.log("response status", response.status); // 200, 400, 500?
  return response.json();
}
Each log is a bisection point. You are not hoping to stumble onto the bug. You are systematically shrinking the universe of suspects.
Binary search debugging is not about adding console.logs randomly. Each log is a deliberate midpoint test. Before adding any log, ask yourself: if this shows the expected value, what does that eliminate? If it shows an unexpected value, what does that eliminate? Logs that cannot answer that question are just noise.
The Step by Step Process
Here is the process distilled to steps you can follow on any bug.
Step 1: Write down the symptom precisely. Not "it is broken" but "clicking submit on the checkout form with a valid credit card shows a spinner that never resolves and no error message."
Step 2: Identify the execution path. Trace the code from user action to expected outcome. For the checkout form: button click fires handleCheckout, which calls processPayment, which calls the Stripe API, which should return a result that triggers redirectToConfirmation.
Step 3: Pick the midpoint of that path. In this case, processPayment is roughly halfway. Add a single log at the start of that function.
Step 4: Test and observe. Does the log appear? Yes or no is the only answer you need.
Step 5: Eliminate half, repeat. If the log appears, the bug is downstream. If not, it is upstream. Pick the midpoint of the remaining half and repeat from Step 3.
Step 6: Stop when you are in a single function. Now you read that function carefully, line by line. You are no longer searching a codebase. You are reading 20 lines of code. The bug will be obvious.
The whole process typically takes 5-15 minutes for bugs that previously took hours. The difference is not cleverness. It is discipline about not skipping steps.

Explore practical debugging guides built for developers working with AI-generated code.
See all guidesWhen Binary Search Debugging Falls Short
This method is not magic. There are three situations where it gets harder.
Non-deterministic bugs. If the bug only appears sometimes, your midpoint tests will give unreliable readings. Race conditions, flaky network calls, and timing-sensitive rendering issues fall into this category. Binary search still helps, but you need to add logging that captures state over time, not just at a single point.
Bugs at the boundaries of systems you do not control. If the issue is in a third-party library, a minified bundle, or a compiled binary, you cannot add midpoint logs inside it. In these cases, binary search applies to your code around the third-party component. You verify your inputs are correct going in and your handling of the output is correct coming out. If both are correct, you have confirmed the issue is in the library itself, which is actually useful information.
Bugs that are really misunderstandings. Sometimes what looks like a bug is working exactly as designed, and the developer had the wrong mental model. Binary search will faithfully narrow you down to the correct line of code, and then you will read it and realize it does what it says. This is still valuable. You learned the truth faster than you would have otherwise.
Do not skip ahead to reading the code before you have narrowed the scope. Reading 500 lines of code without a hypothesis is not debugging; it is hoping. Run the binary search first. Read the code only when you are down to a single function.
What This Means For You
If you are a senior developer, this is the method you probably already use on your best days. The question is whether you use it consistently or only when you are calm and well-rested. Making it a deliberate habit means you bring the same efficiency to a Friday afternoon production incident as you do to a quiet Tuesday morning.
If you are a student or early-career developer, this is the single highest-leverage debugging skill you can develop. It works before you have deep intuition about a codebase. It works on code you did not write. It works on AI-generated code where no one has a clear mental model. Every hour you spend practicing this approach pays back in every project you ever work on.
If you are a founder or career changer building with AI tools, this matters especially. You are likely working in codebases that are partially or mostly AI-generated. When something breaks, you cannot rely on familiarity or years of experience with the code. You need a method that gives you information even when you have no intuition to rely on. Binary search debugging is that method.
The Christmas light problem is always the same. You have a hundred possible culprits and one broken outcome. The question is whether you check them one by one or cut the problem in half until the answer is obvious.
Get practical guides on shipping, debugging, and not losing your mind in the process.
Browse all posts