Logging is the part of operations that always feels boring until 3am, when it suddenly becomes the most important code in the entire app. A well logged production app turns "something is broken" into "exactly this user, doing exactly this action, hit exactly this error" within minutes. A poorly logged app turns the same incident into a multi-hour archaeology project.
This guide covers the four decisions that separate useful logs from noise, what to log, what to skip, how to structure each line, and where to ship logs once you have them. The pattern works for any framework and any hosting platform, the principles do not change.
What to Log
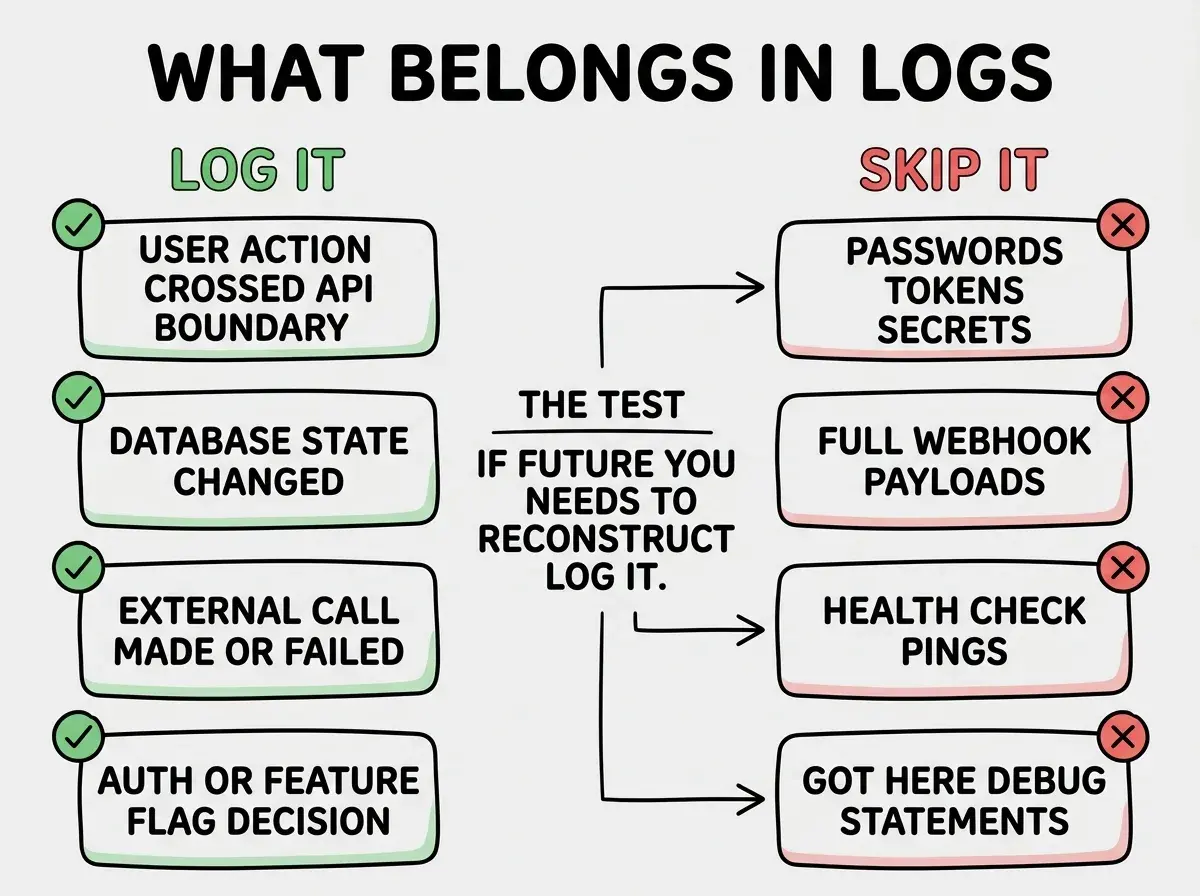
The first question every logging guide answers badly is, what should I log. The honest answer is, log every event that meets at least one of three tests. It crosses a trust boundary, a request from a user, a call to a third-party API, or a webhook from a partner. It changes durable state, a database write, a payment, a file upload. Or it represents a decision your future self will need to reconstruct, an authorization check, a feature flag evaluation, a fallback path being taken.
Everything else is noise. The default console.log statements AI scatters through generated code rarely meet any of the three tests, they log function entry, they log "got here," they log variable values that were already in the request payload. Strip those, and replace them with logs that actually answer "what happened."
A 2024 Honeycomb survey of engineers across 200 companies found that the median time to debug a production issue dropped by 73% when teams switched from unstructured to structured logging. The single biggest factor was attaching a request ID to every log line.
The pattern to copy is the airline black box. It does not record every conversation in the cockpit, it records the events that decisions could be reconstructed from. Your logs should aim for the same density, dense at trust boundaries and state changes, sparse everywhere else.
What to Skip
Just as important as what to log is what not to log. Three categories should never appear in your logs, period.
Personal data and credentials, passwords, API keys, session tokens, full credit card numbers, and any field your privacy policy promises to protect. The pattern is to log identifiers, not contents. Log "user 1234 submitted a form," not the form data. If you must log a sensitive field for debugging, mask all but the last 4 characters and add a TTL on that log stream.
Request bodies of webhooks from payment providers and other systems that include signatures. The signature includes a hash of the body, so storing the body lets anyone with log access replay arbitrary webhooks. Stripe, GitHub, and most reputable webhook senders have public best practice docs that explicitly warn against logging webhook bodies.
Health check pings. Your uptime monitor will hit /api/health 1,440 times per day per check. Logging every ping fills your log retention with noise and makes real events harder to find. Configure your logger to skip health endpoints by default.
The compounding cost of logging too much is paid twice, once on the storage bill and once in debugging speed. A log stream with 1,000 useful events per day is a debugging asset. The same stream with 100,000 useless events per day is a search problem.
How to Structure Log Lines
The single biggest leverage point in logging is moving from string-based logs to structured logs, where every log entry is a JSON object with named fields. The reason is searchability. With strings, you grep. With JSON, you filter, group, and aggregate.
A useful log line has at minimum these fields, timestamp in ISO 8601 format with timezone, level (debug, info, warn, error), message describing what happened in human language, requestId correlating this line to a specific user request, and an event field with a stable string identifying the event type. Add domain-specific fields, userId, orderId, paymentAmount, as appropriate.
import pino from 'pino';
const logger = pino();

logger.info({
  event: 'payment.charged',
  requestId: ctx.requestId,
  userId: user.id,
  orderId: order.id,
  amount: order.total,
  currency: order.currency,
}, 'Payment charged successfully');
The requestId field is the one I would not give up. It is generated once when a request enters your system (usually in a middleware), and every log line emitted while handling that request includes it. When something goes wrong, you grab the request ID from the user-visible error, paste it into your log search, and see every event that happened during that request, in order. Without a request ID, you are correlating timestamps and guessing.
Read the rest of the observability series
Browse the ship categoryFor the rest of the field set, the rule is that any field you might want to filter or aggregate by belongs as a structured field, not in the message string. "User 1234 charged 50 dollars" is hard to query. { "userId": 1234, "amount": 50 } is trivial to query for "all charges over 100 dollars in the last hour."
Where to Ship Logs
Logs that only live on disk, or worse, in your hosting platform's default log viewer, are not enough for production. Most platforms keep logs for 24 to 72 hours by default and provide minimal search. The minimum viable upgrade is shipping logs to a service that stores and searches them.
The three services I recommend for solo builders are Better Stack (formerly Logtail), Axiom, and Datadog. Better Stack has the simplest setup and a generous free tier. Axiom has unlimited retention on its lower paid tiers and excellent query performance. Datadog is the most powerful but the most expensive. All three accept logs over HTTP, so you can ship from any framework with a small wrapper around your logger.
The integration is usually fewer than 20 lines of code. You install a transport library, configure it with an API key from the service, and the service handles ingestion, search, retention, and dashboards. Set retention to 30 days as a starting point, that catches most "this happened last week" investigations without paying for long-tail storage you will not use.
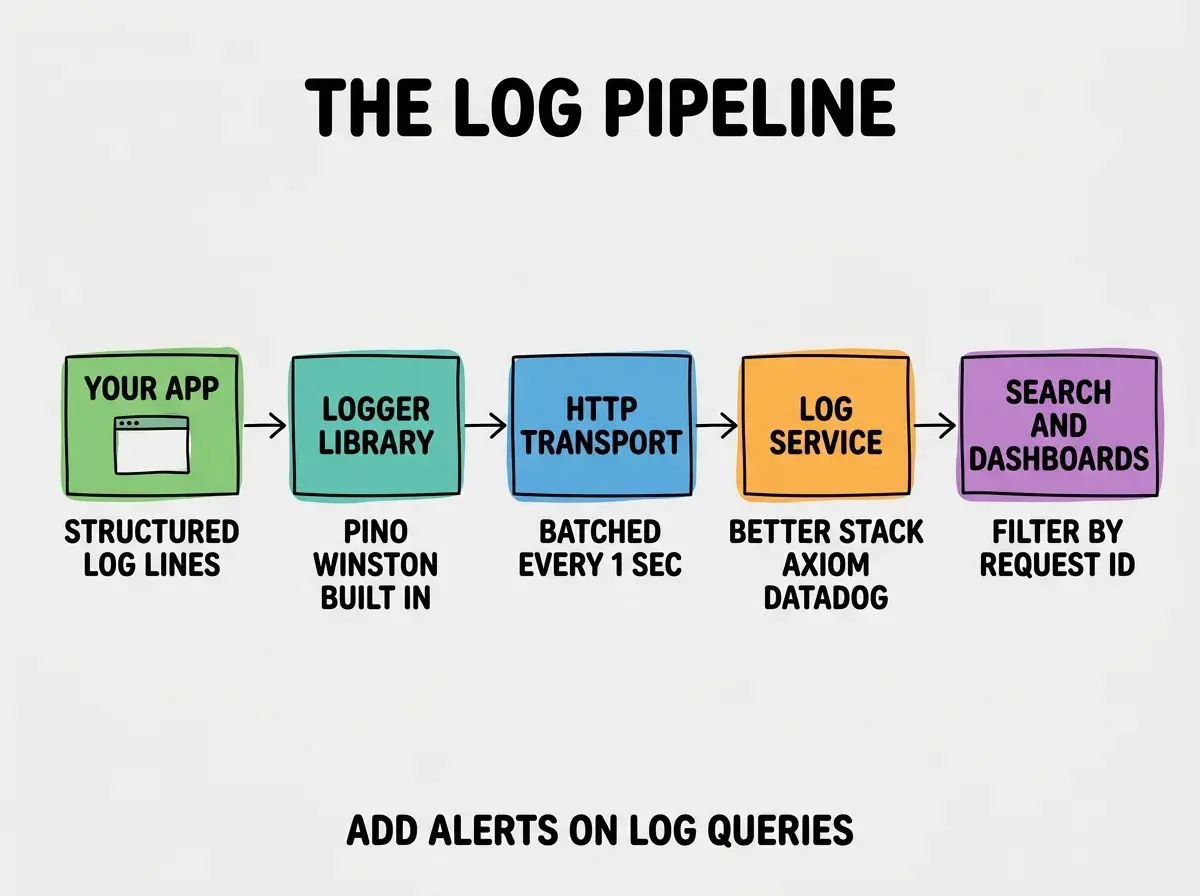
The other piece worth setting up early is alerts on log queries. Most log services let you save a query (for example, "all error level logs in the last 5 minutes") and trigger an alert when the result count exceeds a threshold. This catches patterns your health check cannot, like a spike in 4xx errors from a specific country, or a particular user hitting rate limits repeatedly.
Log Levels Done Right
The four levels worth using are debug, info, warn, and error. The boundary between them is the question, "would I want to be paged for this." Error means yes, immediately. Warn means investigate within hours. Info means useful for reconstructing history but not actionable on its own. Debug means useful during local development, off by default in production.
The most common mistake I see is overusing error. Every caught exception gets logged at error level, which means real errors drown in caught-and-handled noise. The discipline is to log at error level only when something actually went wrong from the user's perspective, not when an expected exception was caught and handled.
The single most expensive logging mistake in vibe coded apps is the password leak through error logs. AI generates code that logs error.context or error.cause, and the context happens to include the request body, which happens to include the password the user submitted. Always sanitize log output, never log raw error objects in production.
The corollary is, when something is genuinely an error from the user's perspective, log it loudly with all the context needed to debug. Cut corners on info, never on error.
What This Means For You
Logging done well is a small upfront investment that pays out every time something goes wrong, which in production is more often than you expect. The setup, structured logs with a request ID, shipped to a searchable service, with sane levels, takes one afternoon and changes your debugging life forever.
- If you're a founder: This is the operational discipline that makes "we will fix it" a credible promise to customers. Without it, every incident becomes a story.
- If you're changing careers: Knowing how to read and configure structured logs is a baseline skill at any modern engineering org. Setting up your own pipeline once gives you the vocabulary to talk fluently in interviews.
- If you're a student: Log a personal project with full structured logging. Write a query that answers "how many times did I do action X this week." That tiny exercise teaches more about observability than a textbook chapter.
Browse more observability and reliability guides
Read more ship guides