92% of US developers use AI tools daily, and React components are probably the most common thing those tools generate. Ask any AI assistant to build a dashboard, a form, a data table, or a navigation component and it will produce something that renders. The UI looks right. The colors match your design system. The interactions work on first try.
Then, three weeks later, your app slows down. A filter change causes the entire page to re-render. A form resets at the wrong moment. A counter shows stale data for half a second before snapping to the correct value. These are not rendering failures. They are hidden performance and state management issues baked into the component structure from the start.
React DevTools is the tool that makes these invisible problems visible. This guide walks you through using it to catch the specific issues AI-generated React components tend to hide.
What React DevTools Actually Shows You
React DevTools is a browser extension available for Chrome and Firefox. Once installed, it adds two panels to your browser's developer tools: Components and Profiler. Most developers know the extension exists but stay on the Network and Console tabs because those feel familiar. The Components and Profiler panels are where the real debugging power lives for react devtools debugging work.
The Components panel gives you a live tree of every React component currently on the page. Click any component and you see its current props, its current state, and the hooks it is running. You can even edit props and state directly in the panel to test how a component responds, without touching your code.
The Profiler panel records component renders. Press record, interact with your app, press stop, and you get a flame graph showing exactly which components rendered, how long each render took, and what triggered the render. For AI-generated code this is invaluable because it reveals unnecessary work that would otherwise stay completely hidden.
Before you start debugging, open your React app in development mode. React DevTools only shows detailed render information in development builds. Production builds strip out the names and context you need. If you are using Create React App, Vite, or Next.js in dev mode, you are already set.
Finding Unnecessary Re-renders
This is the most common performance issue in AI-generated React components, and it is almost always invisible to the naked eye.
AI models tend to structure components in a way that renders correctly but renders too often. They will put state high up in the component tree when it only affects a small section of the UI. They will pass object or array literals as props directly in JSX, which creates a new reference every render and defeats memoization. They will define callback functions inline instead of with useCallback, causing every child component to re-render even when nothing relevant changed.
To find these issues, open the Profiler tab and click the gear icon to access settings. Enable the "Highlight updates when components render" option under the General section. Now go back to your app. Every time a component renders, it flashes with a colored border. Blue means infrequent renders. Yellow and red mean high render frequency.
Interact with your app normally. Click buttons, type in inputs, switch tabs. Watch for components flashing that should not be flashing. If clicking a single button causes fifteen components to flash, something is wrong with the component structure.
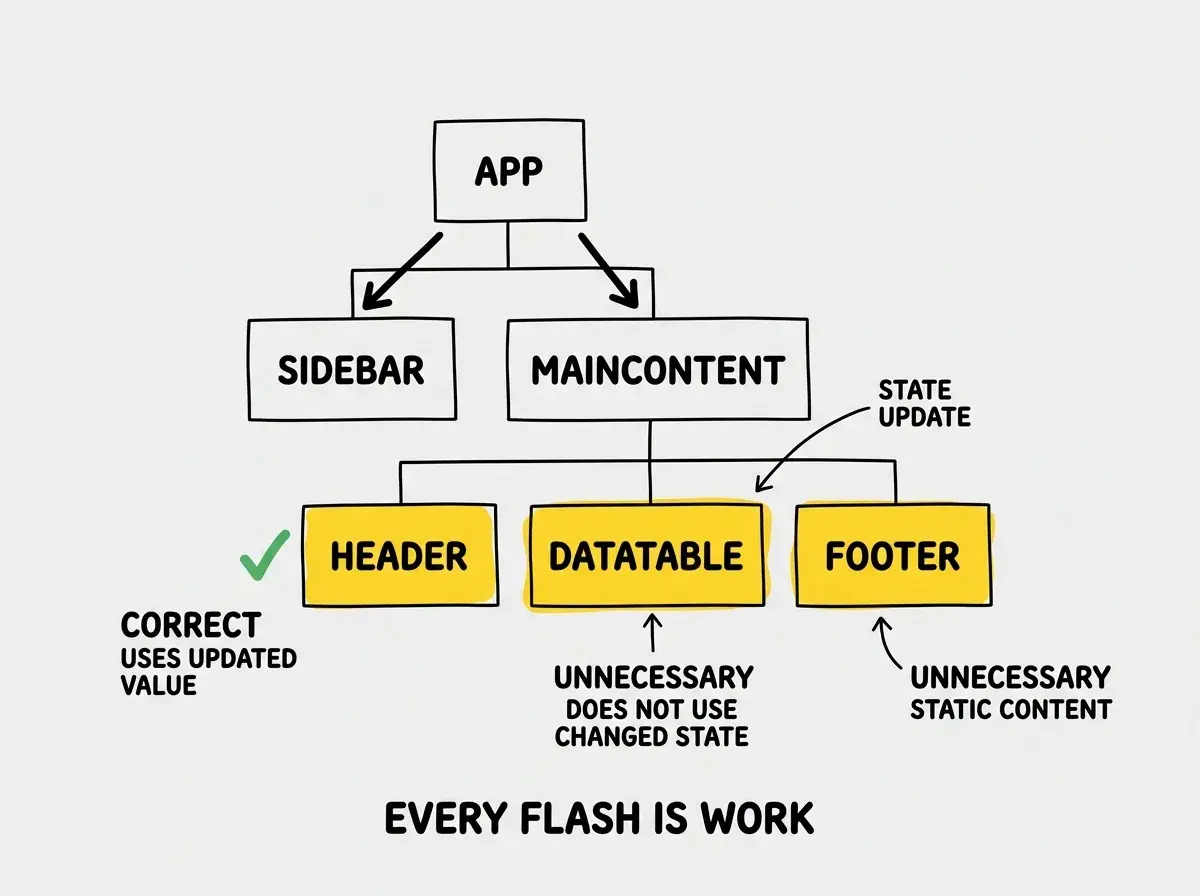
Once you spot a component that re-renders unnecessarily, click on it in the Components panel. Look at its props. If you see a prop that is an object or array, that object is being created fresh on every render of the parent, which means React sees it as a new value even if the content is identical. This is a very common pattern in AI-generated components because the model focuses on making the data flow correctly and misses the reference identity issue.
The fix is usually one of three things: move the state closer to where it is actually used, wrap the problematic prop in useMemo, or wrap the callback in useCallback. React DevTools shows you the what. You then figure out the why from the component code.
Inspecting Props and Tracing State Bugs
The second major use of react devtools debugging is tracking down state bugs, where a component shows the wrong value or updates at the wrong time.
AI-generated components often have stale closure bugs. The component captures a value from state at render time and then uses that captured value inside a callback or effect, but by the time the callback runs, the state has changed. The component is doing work with old data.
To investigate this, open the Components panel and click the component that is displaying wrong data. Look at the State section. You can see the current value of every state variable. If the displayed value does not match what is in the State section, the component is rendering stale data, which points to either a caching issue or a memoization problem where the component is not re-rendering when it should.
If the State section matches what is displayed but the displayed value is wrong, the bug is upstream. Click the parent component and check its state. Work up the tree until you find where the wrong value originates.
React DevTools lets you inspect state at any level of the component tree without adding console.log statements. This is faster and more accurate than logging because you see the live value at any moment, not a snapshot from a single render. For AI-generated code where you did not write the component yourself, this inspection-first approach saves significant time.
The other common state bug is a component that updates too aggressively. A useEffect that fires on every render instead of only when a specific dependency changes will cause visible glitches and subtle data corruption. In the Components panel, click the component and look at the hooks section. You will see each hook listed in order. Effects that run on every render will have an empty dependency array in the code but AI models sometimes omit dependencies or include the wrong ones.
To confirm this, use the Profiler. Record a session, trigger the interaction that feels wrong, and stop recording. Click individual render events in the flame graph. Each event shows you "why did this render?" The reasons will say "state changed", "props changed", or "hooks changed". If you see a component re-rendering when neither its state nor its props changed, a hook with a bad dependency array is almost certainly the cause.
Using the Profiler for Performance Diagnosis
The Profiler is where you go after you have a hunch about a performance problem and you need to confirm it with data.
Open the Profiler tab. Click the record button (the blue circle). Now perform the interaction that feels slow. Stop recording. You will see a bar chart at the top where each bar represents a single commit (a batch of DOM updates). Taller bars mean more expensive renders. Click the tallest bar to see the flame graph for that commit.
The flame graph shows every component that rendered in that commit as a block. Wider blocks took longer. Gray blocks did not render at all during this commit. Colored blocks did render, and the color intensity indicates relative cost.
Look for wide colored blocks that surprise you. An AI-generated list component that renders a hundred items on every keystroke is a common culprit. A context provider that wraps most of your app and re-renders whenever any part of the context value changes will show up as a wide block with a long cascade of children below it.
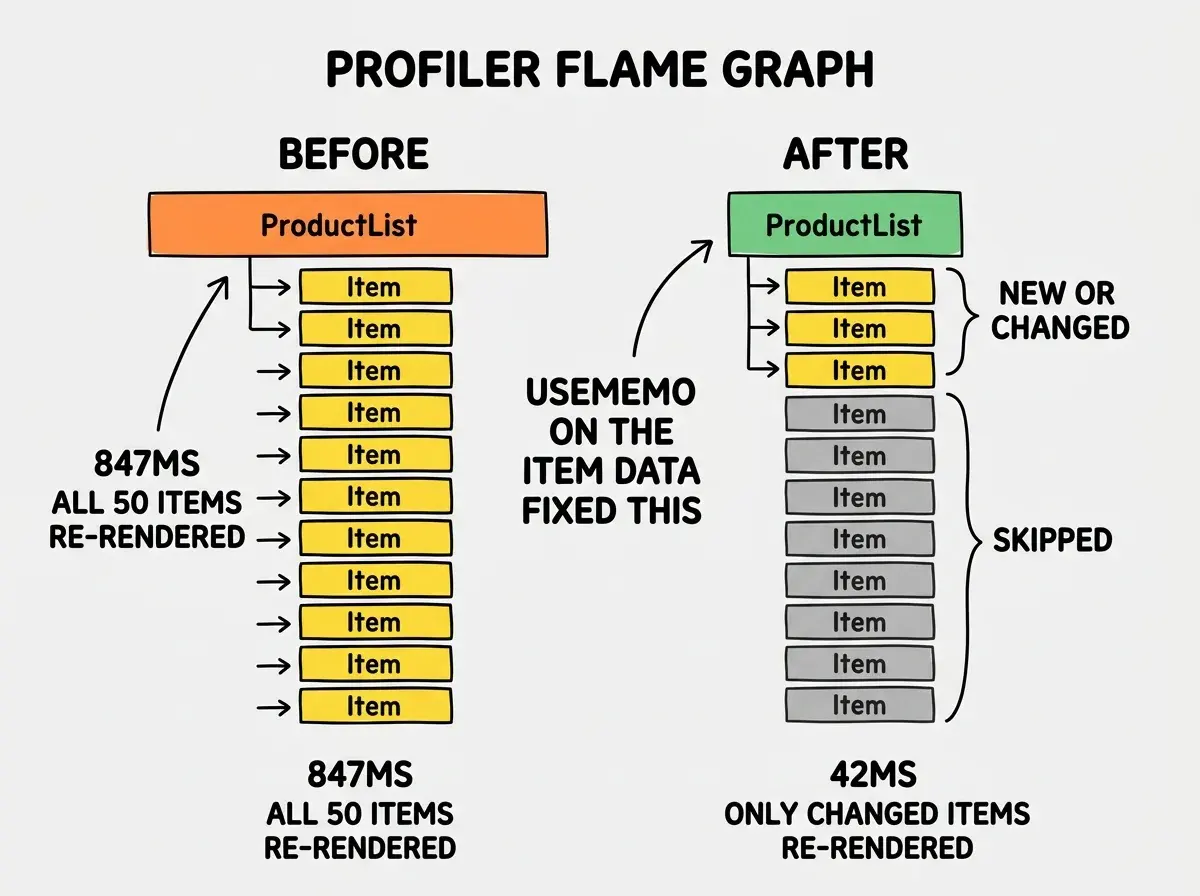
AI models frequently miss the need for React.memo on list item components. If your app renders a list and every item re-renders when you update a single item, the components are not memoized. The Profiler will show this clearly: every item block will be colored during an update commit even when only one item changed.
The fix is straightforward but requires understanding the data flow. Wrap the item component in React.memo. Make sure the props you pass to each item are stable references (use useCallback for event handlers passed as props). Run the Profiler again to confirm that only the changed item re-renders.
A Practical Debugging Session
Here is what a react devtools debugging session looks like from start to finish on a real AI-generated component.
You have an AI-built search interface. Typing in the search box feels slightly sluggish. The results update correctly but there is a noticeable delay.
First, enable highlight updates and type a single character in the search input. If you see the entire results section flash along with components that are nowhere near the search functionality, you have a prop drilling or context problem pushing unnecessary renders through the tree.
Second, open the Profiler and record a session where you type five characters. Stop the recording. Look at the commits that correspond to each keystroke. Click the tallest one. Find the widest colored block in the flame graph. That is your primary suspect.
Third, click that component in the Components panel. Look at its props and state. Ask yourself what changed between keystrokes that would justify re-rendering this component. If the answer is "nothing about this component should change when I type", you have found the bug. The component is receiving a new prop reference on every render of its parent even though the data is the same.
Looking at the wrong layer. When a component renders unnecessarily, developers often try to fix the component itself by adding memoization. But the root cause is usually in the parent: an inline object prop, a freshly defined function, or a context value that gets recreated on every render. React DevTools lets you trace up the tree to find where the instability originates before you start changing code.
Fourth, trace up the tree in the Components panel. Click the parent. Check what it is passing to the sluggish component. If you see something like options={{ filter: searchTerm }} in the code, that object literal is new on every render. The fix is useMemo to stabilize it.
Fifth, apply the fix and run the Profiler again. Confirm the previously wide colored block is now narrower or gray. You are done when the interaction feels responsive and the flame graph confirms the render work is proportional to the actual change.
Making This a Habit
AI-generated React components will continue to render correctly while hiding performance problems. That is just the nature of how these models generate code. They optimize for correctness on the happy path and miss the performance implications of structural choices.
React DevTools turns that invisible problem into a visible one. Spend five minutes with the highlight updates toggle and the Profiler after any significant AI-generated component lands in your codebase. You will catch the issues before they compound across a growing app, rather than diagnosing them under pressure six weeks after launch when users are complaining about sluggishness.
The Components panel and Profiler are not advanced tools. They are the basic inspection instruments for React. Treating them as a default part of reviewing AI-generated code is one of the highest-leverage habits you can build.
The right tools turn invisible performance problems into something you can see, diagnose, and fix in minutes.
Explore more guidesThe Bigger Picture
React DevTools is one layer of the debugging stack for AI-built apps. The Profiler tells you which components render too often. The Components panel tells you what state and props they hold. Together they answer the two questions that cover most performance and state bugs in AI-generated React code: what is rendering when it should not be, and what value does it have when it has the wrong one.
The goal is not to distrust AI-generated components. The goal is to verify them with the same discipline you would apply to any unfamiliar code. A quick Profiler session after an AI writes a complex component is two minutes of work that prevents hours of production debugging. That trade is always worth it.
React DevTools is just the start. There are systematic approaches for every type of AI-generated bug.
Read more