Every broken database query is a crime scene. Something went wrong, and the evidence is sitting right there in your query plans, your logs, and your schema definitions. The trick is knowing where to look. Slow queries leave fingerprints in execution plans. Wrong data has a motive, usually a missing WHERE clause or a bad join. And missing data means someone left through a back door, whether that is an overzealous filter or a Row Level Security policy silently blocking rows.
92% of US developers now use AI coding tools daily, which means more queries are being generated by AI than ever before. Those queries ship with patterns a human developer would have caught in code review. The AI gets the syntax right. The logic, performance, and security implications are where things fall apart.
This guide walks through the three crimes your database queries commit most often.
The Slow Query Investigation
A slow query is the easiest crime to detect. Your page takes four seconds to load. Your API endpoint times out. Your dashboard spins. The user notices before you do.
The first tool in your detective kit is EXPLAIN ANALYZE. This command runs your query and returns the execution plan, showing you exactly how the database processed it, how long each step took, and where time was wasted.
EXPLAIN ANALYZE
SELECT posts.*, users.name
FROM posts
JOIN users ON users.id = posts.user_id
WHERE posts.status = 'published'
ORDER BY posts.created_at DESC
LIMIT 20;
The output tells you everything. Look for sequential scans on large tables (the database is reading every row instead of jumping to the ones it needs), nested loops with high row counts, and sort operations on millions of rows.
The fingerprint you are looking for is a Seq Scan where you expected an Index Scan. That means the database has no index on the column you are filtering or sorting by.
CREATE INDEX idx_posts_status_created ON posts(status, created_at DESC);
A composite index like this one covers both the WHERE filter and the ORDER BY in a single lookup. The database goes straight to the published posts, already sorted by date, and grabs the first twenty. What took 800ms now takes 3ms.
The N+1 Query Pattern
The most common slow-query crime in AI-generated code is the N+1 problem. The AI builds a function that fetches a list of items, then loops through each one and fires a separate query for related data.
// The crime scene: N+1 queries
const posts = await db.query('SELECT * FROM posts LIMIT 50');
for (const post of posts) {
  post.author = await db.query(
    'SELECT * FROM users WHERE id = $1', [post.user_id]
  );
}
That is 51 database round trips for what should be one query. At 5ms per round trip, you are burning 255ms on network latency alone.
The fix is a single query with a JOIN, or if you are using an ORM, an eager loading directive.
// The fix: one query with a join
const posts = await db.query(`
  SELECT posts.*, users.name as author_name
  FROM posts
  JOIN users ON users.id = posts.user_id
  LIMIT 50
`);
If you are using Supabase, turn on query logging in your dashboard under Settings > Database > Query Performance. This shows every query hitting your database, how long it took, and how many times it ran. When you see the same SELECT repeated fifty times in a row, you have found your N+1.
Run EXPLAIN ANALYZE on every query that touches a user-facing page. If you see a Seq Scan on a table with more than a few thousand rows, you almost certainly need an index. A single missing index can turn a 3ms query into an 800ms query, and that difference compounds when you have concurrent users.
The Wrong Data Lineup
Wrong data is a subtler crime. The query runs fast, returns results, and nothing explodes. But the numbers are off. The totals do not match. Calculations come back inflated.
The motive is almost always a missing or incorrect WHERE clause. AI-generated queries are prone to this because the AI optimizes for "return something that looks right" rather than "return exactly what was requested."
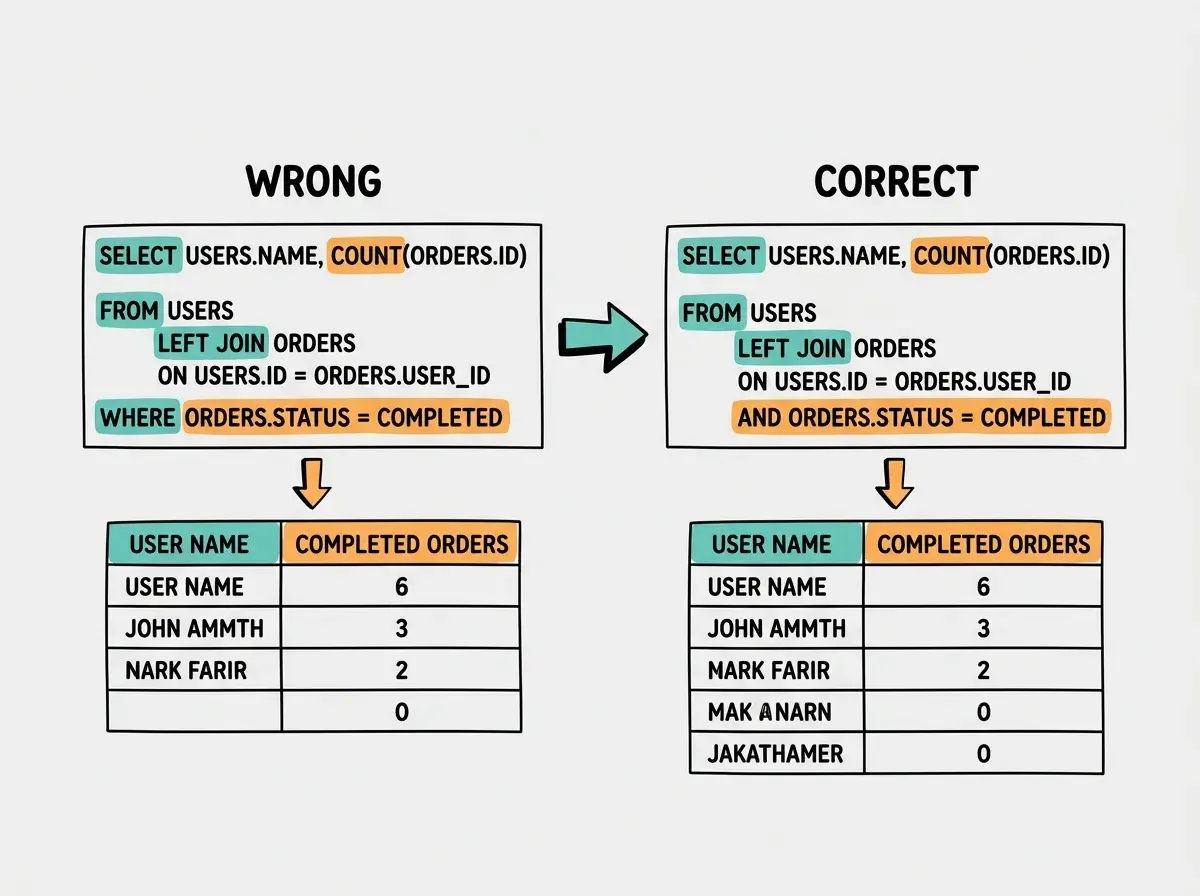
-- AI-generated: looks correct, but counts ALL orders
SELECT users.name, COUNT(orders.id) as order_count
FROM users
LEFT JOIN orders ON orders.user_id = users.id
GROUP BY users.name;

-- What you actually needed: only completed orders
SELECT users.name, COUNT(orders.id) as order_count
FROM users
LEFT JOIN orders ON orders.user_id = users.id
  AND orders.status = 'completed'
GROUP BY users.name;
Notice where the filter goes. Putting orders.status = 'completed' in a WHERE clause instead of the JOIN condition changes the semantics entirely. With WHERE, users with zero completed orders disappear from results. With the JOIN condition, they stay with a count of zero. The AI picks whichever pattern it saw more often in training data, not the one your business logic requires.
Investigating Wrong Aggregations
When your totals look wrong, isolate the problem by removing complexity. Strip the query down to its simplest form and verify each piece.
-- Step 1: Check raw data
SELECT * FROM orders WHERE user_id = 'specific-user' AND status = 'completed';

-- Step 2: Verify the count manually
SELECT COUNT(*) FROM orders WHERE user_id = 'specific-user' AND status = 'completed';

-- Step 3: Now add the join and grouping back
SELECT users.name, COUNT(orders.id) as order_count
FROM users
LEFT JOIN orders ON orders.user_id = users.id
  AND orders.status = 'completed'
WHERE users.id = 'specific-user'
GROUP BY users.name;
If step 2 gives you 7 and step 3 gives you 14, you have a join that is multiplying rows. This happens when the join path hits a many-to-many relationship or duplicate rows in one of the tables. Add a DISTINCT or restructure the join to eliminate duplication.
The Missing Data Back Door
Missing data is the hardest crime to investigate because the absence of evidence is not evidence of absence. The query returns results, just not all of them. Users report that records vanished, or a dashboard shows fewer items than expected.
The back door is usually one of three things: an unintended filter, a Row Level Security policy, or a soft-delete flag the query forgot to account for.
Row Level Security Policies
If you are using Supabase or any Postgres setup with RLS enabled, this is the first place to look. RLS policies silently filter rows based on the current user's identity. A query that returns 100 rows for you might return 0 rows for another user, and neither of you sees an error.
-- Check what RLS policies exist on a table
SELECT * FROM pg_policies WHERE tablename = 'documents';
The most common RLS problem in AI-generated code is a policy that references auth.uid() while the query runs in a context where no user is authenticated (server-side API calls, background jobs). The policy evaluates auth.uid() as NULL, NULL never matches anything, and every row gets filtered out.
-- This policy blocks all unauthenticated access silently
CREATE POLICY "Users see own docs" ON documents
  FOR SELECT USING (user_id = auth.uid());

-- A service role connection bypasses RLS entirely
-- But a regular connection with no auth context returns zero rows
The fix depends on your architecture. For server-side operations that need full access, use the service role key (which bypasses RLS). For operations that should respect RLS in a server context, pass the user's JWT to the Supabase client.
The Soft-Delete Trap
Many AI tools generate schemas with a deleted_at column for soft deletes. The AI adds the column but does not consistently filter on it.
-- AI generated this query but forgot the soft-delete filter
SELECT * FROM projects WHERE team_id = 'abc123';

-- What it should be
SELECT * FROM projects WHERE team_id = 'abc123' AND deleted_at IS NULL;
This works both ways. Sometimes deleted records appear when they should not. Sometimes the filter is inconsistent, so your list endpoint shows 10 items but your count shows 12.
The detective move here is to check every query that touches a soft-deletable table and verify the deleted_at IS NULL condition is present. Better yet, create a database view that applies the filter automatically.
CREATE VIEW active_projects AS
SELECT * FROM projects WHERE deleted_at IS NULL;
Query the view instead of the table. The AI cannot forget the filter if it never needs to add it.
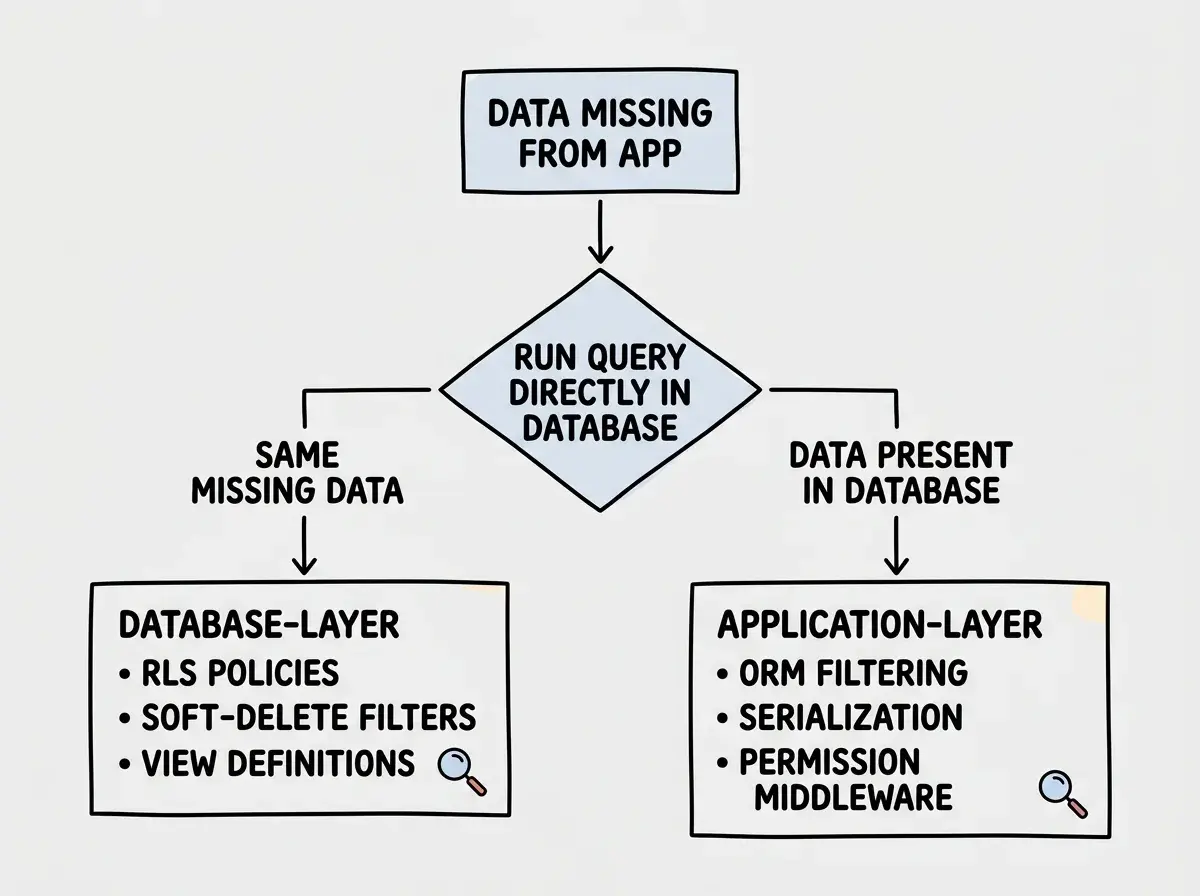
Debugging missing data by only looking at application code. The query might be perfect, but an RLS policy, a database trigger, or a view definition is modifying results before they reach your app. Always check the database layer directly using psql or your database dashboard. Run the exact same query there and compare results. If the database returns different data than your app shows, the problem is between the database and your application code. If the database also returns incomplete data, the problem is in the database layer itself.
Here is a decision tree for tracking down missing data.
Building Your Investigation Toolkit
Every senior developer needs a repeatable process for database debugging. Here is the toolkit that covers all three crime types.
For slow queries: Enable query logging and run EXPLAIN ANALYZE on anything over 100ms. Check for missing indexes on filtered and sorted columns. Count query frequency to spot N+1 patterns.
For wrong data: Strip queries to their simplest form and verify each component. Check JOIN types and filter placement. Verify aggregations against manual counts.
For missing data: Query the database directly, bypassing your application. Check RLS policies with pg_policies. Verify soft-delete filters. Test with different auth contexts.
The AI that wrote your queries did not investigate whether they were correct. That investigation is your job. Databases are honest witnesses. They keep detailed logs, show you their execution plans, and never hide evidence. You just need to ask the right questions.
Make sure your database queries survive production traffic.
Read the deployment checklistA query that works in development and breaks in production is the difference between a solved case and a cold one. Development has ten rows and one user. Production has millions of rows, concurrent users, and RLS policies you forgot you enabled. Investigate now, while the evidence is fresh.
Get practical tutorials for shipping AI-built applications that actually work.
Browse all tutorials