Memory leaks in React are silent. The app works, the UI renders, your tests pass. Then, after twenty minutes of use, the browser tab consumes 800MB of memory and everything slows to a crawl. AI-generated React code creates this problem more often than human-written code, and for a specific reason: AI models are optimized to produce code that runs correctly once, not code that cleans up after itself over time.
Why AI-Generated React Code Leaks More
When a senior developer writes a useEffect, they know from experience that every subscription, every timer, and every event listener they register needs a corresponding cleanup function. That knowledge is internalized from having debugged enough production apps to feel the pain of forgetting it.
AI models do not accumulate scar tissue. They generate code based on pattern frequency in training data, and the most common pattern in training data is the happy path. A useEffect that sets up a WebSocket connection and renders incoming data is a clear, common pattern. The cleanup function that tears down that connection when the component unmounts is less consistently present in training examples, so it gets generated less consistently.
The result is a class of bugs that are structurally invisible. The code compiles. The tests that check whether data renders will pass. The only thing that fails is the thing that happens when a component you cannot see any more continues to hold memory and execute callbacks in the background.
There are five patterns AI generates that account for the vast majority of React memory leaks. Understanding each one is the prerequisite for debugging them.
How to Debug Memory Leaks in React
Before you can fix a leak, you need to confirm you have one and locate where it originates. Chrome DevTools Memory tab with heap snapshots is the right tool for this.
Open Chrome DevTools and navigate to the Memory tab. Select "Heap snapshot" and take a baseline snapshot before triggering the interaction you suspect is leaking. Label it "before" in your head. Now perform the interaction, wait a few seconds, and take a second snapshot. Switch the view to "Comparison" between the two snapshots.
The comparison view shows you what was allocated between the two snapshots and what was not collected. Sort by "Delta" (the difference in retained size). Objects you expect to be gone, ones from a component that unmounted, will appear here if they are leaking. Look for React fiber nodes, event listeners labeled EventListener, and closure scopes holding onto large objects.
The more targeted approach is the "Allocation instrumentation on timeline" recording. Press record, interact with your app for thirty to sixty seconds performing the actions you suspect cause the leak, then stop. The timeline will show allocation spikes. Blue bars are allocations that were later collected. Gray bars (which stay gray after collection runs) are retained allocations. Clusters of retained allocations that correspond to specific user interactions are your leaks.
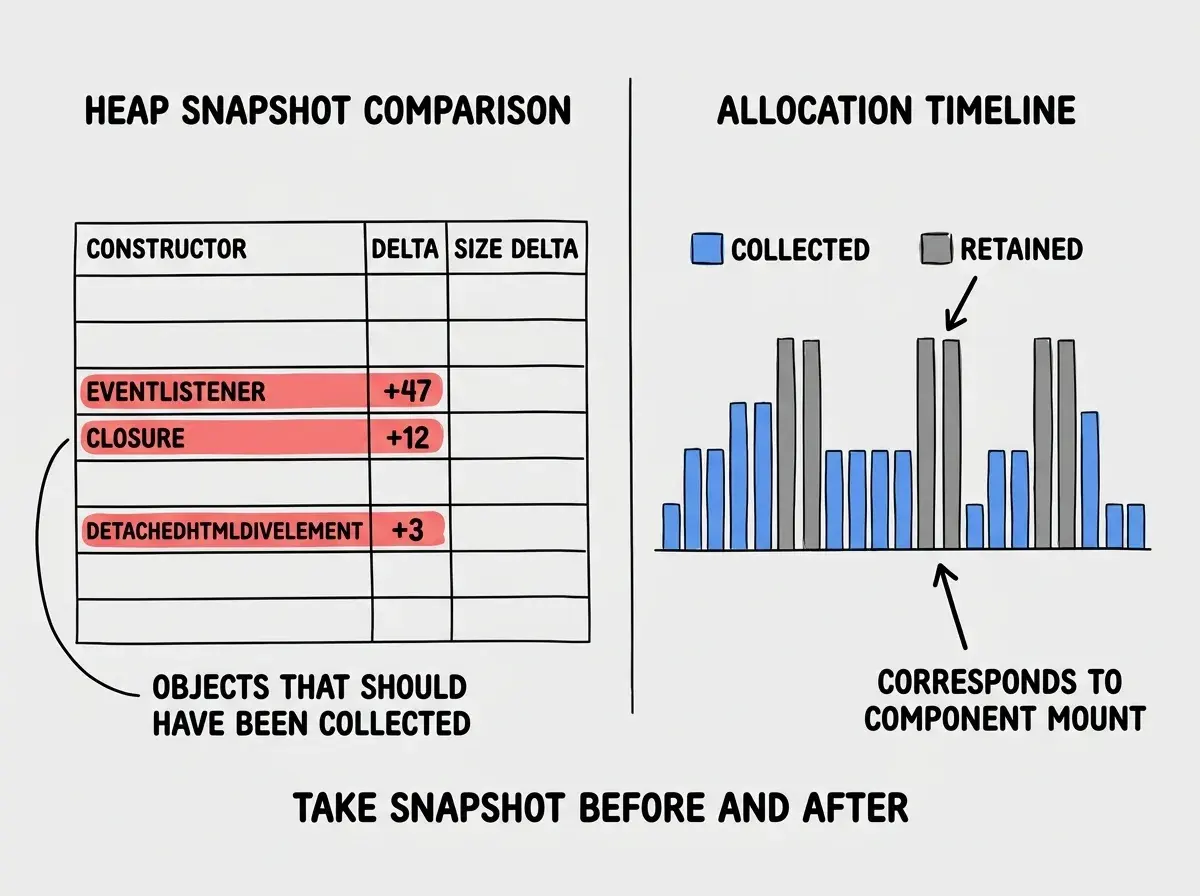
Once you have identified the type of retained object, the next step is tracing it back to the component. For event listeners, click the retained EventListener entry and look at the retaining path in the bottom panel. It will show you the call chain that registered the listener. For closure leaks, the retaining path will show which variable the closure holds onto and the component it originated in.
With the retained object type and the component identified, you can cross-reference against the five patterns below to find the specific fix.
The Five Most Common AI-Generated Memory Leaks
Missing useEffect Cleanup for Subscriptions
The most frequent leak. AI generates a useEffect that subscribes to an external data source, a WebSocket, an EventEmitter, a third-party analytics library, or a custom event system, and returns nothing. The subscription is created when the component mounts and is never destroyed.
// What AI generates
useEffect(() => {
  const subscription = dataStream.subscribe(data => {
    setStreamData(data);
  });
  // No return. The subscription runs forever.
}, []);

// What it should be
useEffect(() => {
  const subscription = dataStream.subscribe(data => {
    setStreamData(data);
  });
  return () => subscription.unsubscribe();
}, []);
The cleanup function returned from useEffect runs when the component unmounts and before the effect re-runs if dependencies change. Without it, every mount of this component adds another subscription to the pile. Navigate to a route three times and you have three active subscriptions all fighting to update state on a component that may not even be in the DOM.
Event Listeners Added to Global Objects
AI frequently generates code that attaches event listeners to window, document, or document.body directly inside a component. These global objects exist for the lifetime of the browser tab. An event listener attached to them from within a React component does not automatically disappear when that component unmounts.
// What AI generates
useEffect(() => {
  window.addEventListener('resize', handleResize);
  document.addEventListener('keydown', handleKeyDown);
  // No removal. These persist after the component unmounts.
}, []);

// What it should be
useEffect(() => {
  window.addEventListener('resize', handleResize);
  document.addEventListener('keydown', handleKeyDown);
  return () => {
    window.removeEventListener('resize', handleResize);
    document.removeEventListener('keydown', handleKeyDown);
  };
}, []);
This pattern is especially insidious because the handlers often hold references to component state via closures. When the component unmounts, the handler still holds a stale reference to the old state and tries to update it, which triggers the "Can't perform a React state update on an unmounted component" warning in development builds.
Timers Left Running
setInterval and setTimeout are the simplest leaks to understand and among the most commonly introduced by AI. Any timer created inside a component without a corresponding clearInterval or clearTimeout in the cleanup will keep firing after the component unmounts.
// What AI generates
useEffect(() => {
  const interval = setInterval(() => {
    setCount(prev => prev + 1);
  }, 1000);
  // No clearInterval. The interval runs until the tab closes.
}, []);

// What it should be
useEffect(() => {
  const interval = setInterval(() => {
    setCount(prev => prev + 1);
  }, 1000);
  return () => clearInterval(interval);
}, []);
In the heap snapshot, a leaked interval shows up as retained closure entries with references to your component's state setter functions. The interval callback captures those setters and holds them alive even after the component is gone.
Closures Holding Large Object References
This one is subtler. AI-generated code sometimes creates closures that capture large objects unnecessarily, and those closures get attached to long-lived structures (callbacks stored in global state, memoized values with wrong dependencies, third-party library callbacks).
// What AI generates: fetchedData is potentially large
const handleAction = useCallback(() => {
  processItem(fetchedData, selectedId);
}, [fetchedData]); // fetchedData is a 500-item array

// Passed to a long-lived external library
externalLib.registerHandler('action', handleAction);
If externalLib.registerHandler stores that callback permanently and useCallback returns a new function every time fetchedData changes, you now have a growing list of old closures in the external library's registry, each one holding a reference to a previous version of your large data array.
The fix is to think carefully about what data the callback actually needs at call time versus what it captures at definition time. If the callback only needs selectedId and can look up the current data via a ref, the closure does not need to capture the large array at all.
The pattern that makes AI-generated closures leak is the combination of a long-lived external registration point (event system, third-party library, global state) and a callback that captures component-local data. Either the registration needs a corresponding deregistration, or the callback needs to be redesigned to not capture the large data directly.
State Updates on Unmounted Components
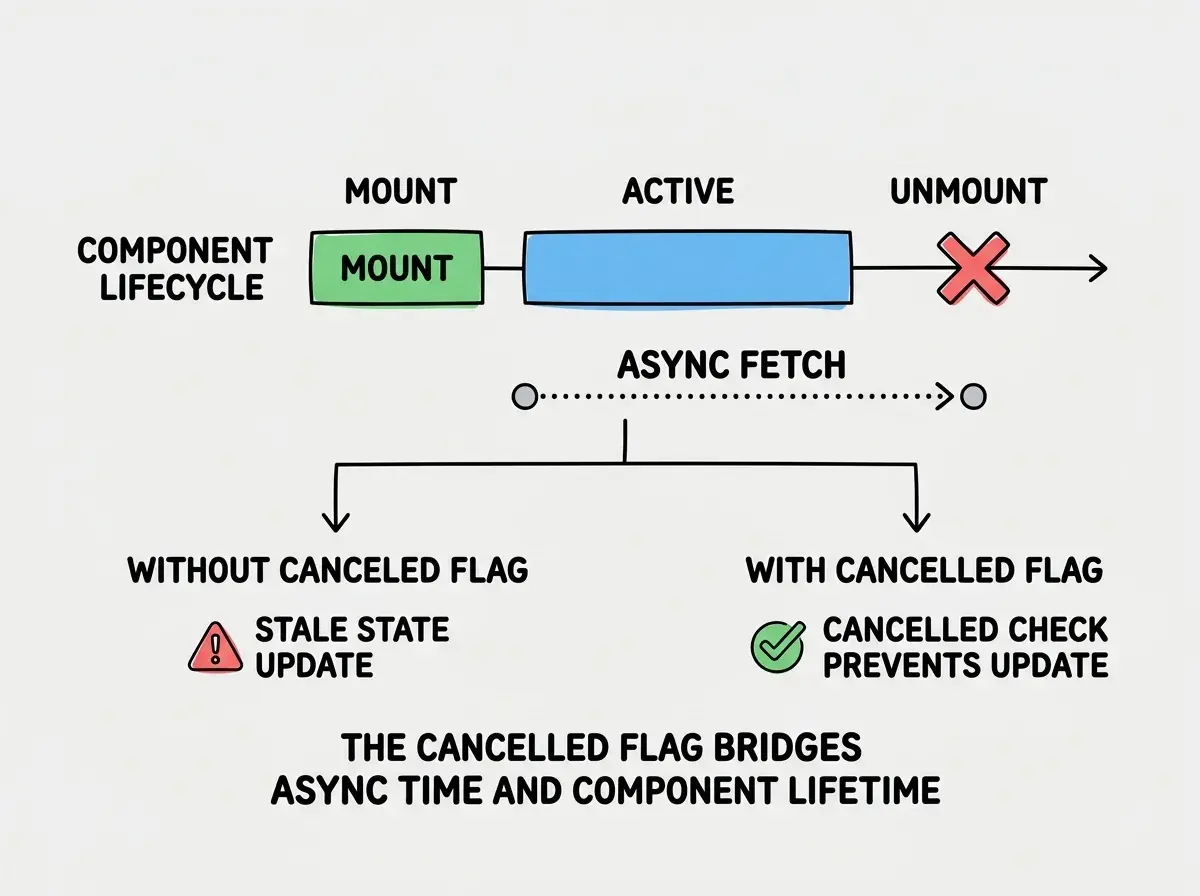
React 18 removed the warning for this pattern, but the underlying problem remains. When an async operation (a fetch call, a promise chain, a delayed callback) completes after the component that started it has unmounted, any state update attempt operates on a component that no longer exists.
// What AI generates
useEffect(() => {
  fetchUserData(userId).then(data => {
    setUserData(data); // What if the component unmounted while fetching?
  });
}, [userId]);

// What it should be
useEffect(() => {
  let cancelled = false;
  fetchUserData(userId).then(data => {
    if (!cancelled) setUserData(data);
  });
  return () => { cancelled = true; };
}, [userId]);
The cancelled flag pattern is the most reliable cross-environment solution. If you are working in an environment where you can use AbortController to cancel the underlying fetch, that is cleaner, but the cancelled flag works for any async operation including third-party SDK calls that do not expose cancellation.
How Does React Handle Memory Leaks
React itself does not prevent memory leaks. It provides the mechanism (the cleanup function returned from useEffect) but it cannot enforce that you use it. The reconciler manages the lifecycle of components and calls cleanup functions when it unmounts a component, but if you never provided a cleanup function, there is nothing for the reconciler to call.
React 18's concurrent features make this slightly more complex. With StrictMode enabled in development, React intentionally mounts and unmounts components twice to surface exactly this class of bugs. If your development build logs a warning about state updates on unmounted components, or if you notice your subscriptions firing twice, that is StrictMode telling you that your effects are not cleanup-safe. Pay attention to it. The double-invoke behavior only happens in development, but it reveals real cleanup problems.
The garbage collector in V8 (Chrome's JavaScript engine) handles the actual memory reclamation. It uses a mark-and-sweep algorithm that starts from root objects (the global scope, active stack frames) and marks everything reachable. Anything unreachable after the mark phase gets swept. A React component that has unmounted is unreachable from the component tree, but if a global event listener, an active timer, or a long-lived external library holds a reference to something inside that component's closure, the garbage collector cannot collect it. The component is gone from React's perspective but alive in memory from V8's perspective.
This is the fundamental reason why cleaning up effects matters: you are not just telling React the component is gone; you are removing the external references that keep the component's closure alive in the heap.
What This Means For You
If you are a senior developer reviewing AI-generated React code:
- Add cleanup functions to every
useEffectas a default code review checklist item, even before reading the logic - Run a two-minute heap snapshot comparison after any AI-generated component that involves subscriptions, timers, or async operations gets merged
- Look specifically at
useEffecthooks with empty dependency arrays; these are the most likely to have unguarded long-lived resources
If you are transitioning from another role or earlier in your React career:
- The
useEffectreturn function is not optional cleanup for performance; it is required cleanup for correctness in any component that sets up resources - Chrome DevTools Memory tab is not an advanced tool; it is a basic verification step for any component that talks to external systems
If you are a founder or solo builder working with AI tools:
- Memory leaks rarely cause immediate failures in testing, which is why they reach production
- A leak in a component that mounts on every page view will compound; the memory cost doubles every time the user navigates back to that page
- The five-minute investment of running a heap snapshot comparison before shipping a feature that uses real-time data or polling is worth far more than the debugging session it prevents
Assuming that because AI-generated code does not throw errors and passes visual testing, it is also correct with respect to resource cleanup. React memory leaks are structurally invisible to functional tests. The only reliable way to catch them before production is a combination of code review for missing cleanup functions and periodic heap snapshot verification during development.
The hardest part of debugging AI-generated memory leaks is not fixing them once you find them. Every fix in this guide is one or two lines. The hard part is developing the reflex to look for them before the performance complaint comes in from a user who kept the tab open for three hours.
Memory leaks are one of the highest-leverage things to verify in AI-generated React code. The fix is almost always one or two lines.
Explore more guidesThe five patterns above, missing effect cleanup, unremoved event listeners, running timers, closures holding large objects, and state updates on unmounted components, cover the vast majority of what you will encounter in AI-generated React code. Each one has a consistent signature in heap snapshots and a consistent fix in code. Build the habit of checking for them and you will stop seeing leaked memory reports from production.
Systematic approaches for every category of bug AI-generated code introduces.
Read more