Production debugging means investigating and fixing bugs on a live system while real users are actively using it. This is fundamentally different from local debugging because every action you take carries risk: a bad query can crash your database, a hasty deploy can make things worse, and logging too aggressively can fill your disk and create a second outage on top of the first.
For AI-built applications, production debugging has an additional challenge. You may not fully understand the code that is failing because AI generated it weeks or months ago. This guide covers the systematic approach to investigating production issues without making things worse.
Why Production Debugging Differs From Local Debugging
Local debugging is exploratory. You can add console logs everywhere, restart the server repeatedly, drop and recreate the database, and try random fixes with no consequences. Production debugging is surgical. Every change affects real users, and the pressure to fix the problem quickly leads to the exact kind of rushed decisions that create new problems.
The most important difference is information scarcity. Locally, you can reproduce the bug, step through code, and inspect every variable. In production, you often have only an error message, a timestamp, and maybe a user report that says "it stopped working." Your investigation has to reconstruct what happened from incomplete evidence.
41% of AI-generated code gets reverted within two weeks. A significant portion of those reverts happen after production incidents where code that "worked in development" failed under real conditions. The patterns in this guide help you handle those failures methodically instead of reverting blindly and hoping the problem goes away.
For AI-built applications specifically, production debugging often reveals issues that AI introduced subtly: missing error boundaries, unhandled edge cases, race conditions that only appear under concurrent load, and API integrations that fail silently when third-party services return unexpected responses.
Setting Up Production Observability Before Things Break
The best time to set up production monitoring is before you need it. The second-best time is right now. Without observability, production debugging is guesswork.
Error tracking with Sentry. Configure Sentry to capture unhandled exceptions, rejected promises, and specific error boundaries. The critical configuration most people skip is source maps. Upload your source maps during build so Sentry shows you the original TypeScript line that failed, not the minified bundle line that is meaningless.
Structured logging. Replace console.log statements with a structured logger that outputs JSON with consistent fields: timestamp, request ID, user ID, action, and context. When investigating an incident, you can filter logs by request ID to trace a single user's journey through your system. Vercel, Cloudflare, and most hosting platforms capture console.log output, but structured JSON is searchable while freeform text is not.
Uptime monitoring. UptimeRobot or Better Uptime checks your app every five minutes and alerts you when it goes down. Configure health check endpoints that verify database connectivity, not just that your server responds. A health check that returns 200 while the database is unreachable gives you false confidence.
Performance baselines. Know what "normal" looks like. If your API usually responds in 200ms and suddenly takes 3 seconds, that is a signal even if no errors are thrown. Sentry's performance monitoring or a simple custom metric that logs response times gives you this baseline.
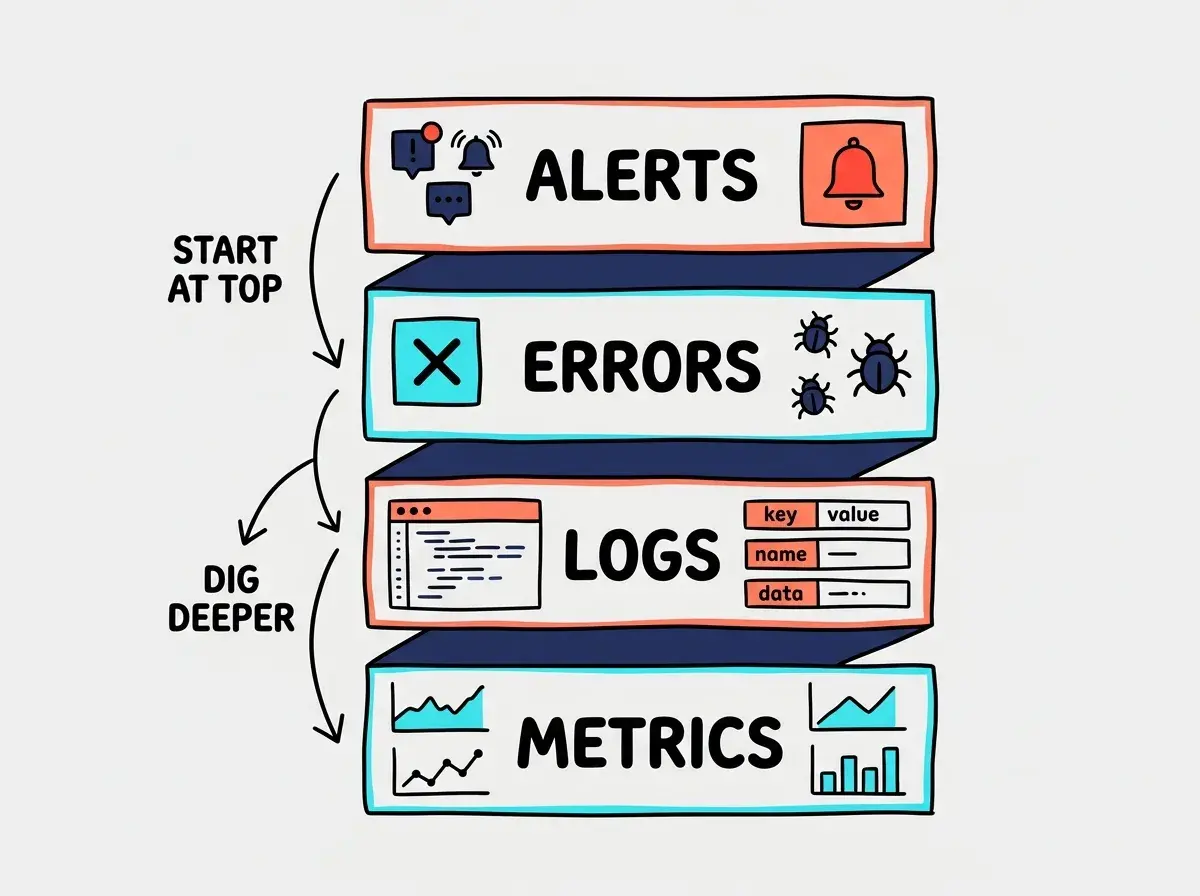
Set up all four layers before your first real user touches the system. The total cost on free tiers is $0 for UptimeRobot, $0 for Sentry (5,000 events per month), and $0 for structured logging through your hosting platform.
The Production Debugging Workflow
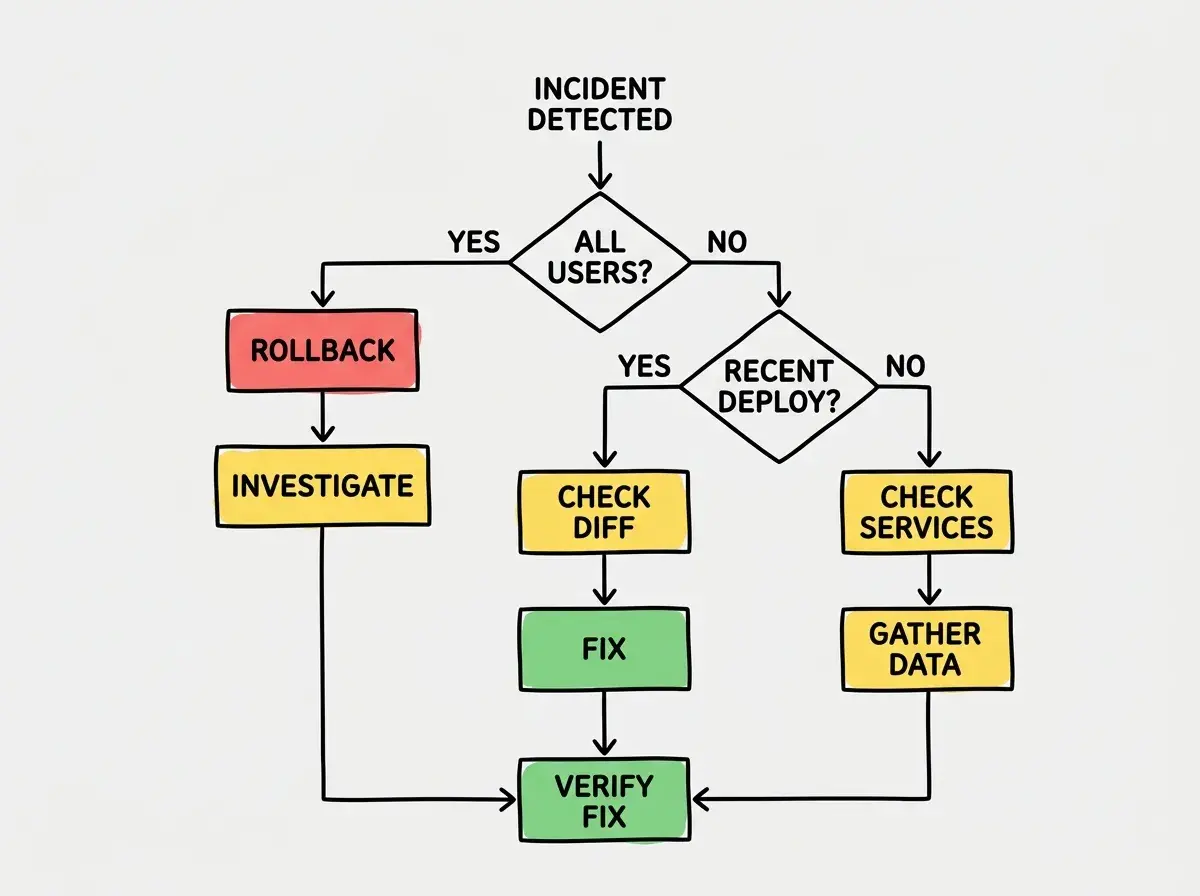
When something breaks in production, resist the urge to start changing code immediately. Follow this sequence.
Step 1: Assess the blast radius. Is this affecting all users, some users, or one user? Check your error tracking dashboard for the number of affected users and the frequency of the error. A bug that affects 100% of users on a specific page is a different priority than a bug that affects 1% of users performing an unusual action.
Step 2: Check the timeline. When did this start? Was there a deployment, a dependency update, or a third-party service change around that time? The most common cause of production bugs is "we deployed something." If you can correlate the error start time with a specific deployment, you already know where to look.
Step 3: Read the error, all of it. The full stack trace, not just the error message. In AI-built apps, the actual bug is often three or four frames deep in the stack trace, not at the top. The top frame tells you where the error surfaced. The deeper frames tell you what caused it.
Step 4: Reproduce with constraints. Try to reproduce the issue in a staging environment or with a test account in production. If you cannot reproduce it, gather more data: user agent, request payload, timing, and any state that might be different from your test environment.
Step 5: Fix or mitigate. If the fix is clear and small, apply it. If the fix is complex, consider a mitigation first: disable the affected feature, add a temporary error boundary, or roll back to the previous deployment while you work on a proper fix.
Set up observability before your next incident. The 30 minutes you invest now saves hours of guesswork later.
See all Ship guidesThe sequence matters. Skipping straight to step 5 (changing code) without steps 1 through 4 is how you introduce new bugs while trying to fix old ones.
Advanced Techniques for Complex Production Issues
Some production bugs resist the basic workflow. They happen intermittently, they cannot be reproduced locally, or they involve multiple systems interacting in unexpected ways.
Tracing requests across services. If your app calls external APIs (Stripe, Supabase, third-party services), add a correlation ID to every outbound request. Log this ID on both the request and response. When a user reports a problem, you can trace their request from your frontend through your API to the external service and back, identifying exactly where the failure occurred.
Database query analysis. Slow or failing database queries are a common source of production issues in AI-built apps because AI often generates queries that work fine with 100 rows but degrade at 10,000 rows. Use your database provider's query analysis tools (Supabase Dashboard, Neon query stats) to identify slow queries. Common fixes: add indexes on filtered columns, limit result sets with pagination, and avoid N+1 queries where a loop makes one database call per item.
Memory and resource leaks. AI-generated React code frequently creates memory leaks through useEffect hooks that set up subscriptions or intervals without cleanup functions. In production, these leaks accumulate until the browser tab crashes or the server runs out of memory. Monitor memory usage over time, not just at a single point. A sawtooth pattern (rising, dropping, rising higher) indicates a leak.
Canary deployments for risky fixes. When you are not confident in a fix, deploy it to a small percentage of traffic first. Vercel and Cloudflare both support traffic splitting. Route 5% of users to the new version, monitor for 30 minutes, then gradually increase to 100% if no new errors appear. This approach contains the blast radius of a bad fix.
Post-incident analysis. After every significant production incident, write a brief postmortem: what happened, when it started, how it was detected, what the fix was, and what would have prevented it. For AI-built apps, add one more question: did AI generate the code that failed, and if so, what pattern should you watch for in future AI output? This builds an institutional memory that makes each incident less likely to repeat.
Deploying a "quick fix" to production without testing it in a staging environment first. The pressure of a live incident makes you want to push a fix immediately, but a bad fix on top of an existing bug doubles your problems. Take the extra five minutes to verify your fix works before shipping it. If the incident is severe enough that five minutes matters, roll back to the previous working version first, then work on the fix without time pressure.
The best production debugging skill is not technical. It is emotional regulation. The ability to stay calm, follow a process, and resist the urge to make rapid changes while users are affected separates experienced engineers from everyone else.
Building Production Debugging Muscle
Production debugging is a skill that improves with practice. These habits accelerate the learning curve.
Review production logs weekly, even when nothing is broken. You will start noticing patterns: warnings that precede errors, slow queries that are getting slower, error rates that creep up gradually. These early signals let you fix problems before they become incidents.
Conduct fire drills. Intentionally break something in staging (or in production with a feature flag), then practice the debugging workflow. This builds muscle memory for the investigation sequence so you do not have to think about process during a real incident.
Document your system's failure modes. For each external dependency (database, API, payment provider, email service), write down what happens when it fails. Does your app show an error page? Does it hang? Does it return stale data? Knowing your failure modes in advance means you can identify the failing dependency faster during an incident.
Dig deeper
A few hand-picked sources if you want to go further.
What This Means For You
- If you're a founder: Set up Sentry and UptimeRobot before your first user touches your app. When something breaks, check Sentry first, then contact your developer or AI tool with the specific error message. Do not describe the problem in general terms.
- If you're changing careers: Production debugging experience is one of the most valued skills in software engineering hiring. Build a side project, deploy it, and practice investigating real issues. This experience transfers directly to professional work.
- If you're a student: Study postmortems from real companies. Google, Cloudflare, and Stripe publish detailed incident reports that teach you how experienced engineers investigate production failures. Reading five postmortems teaches more than reading a textbook chapter on debugging.
Production issues are inevitable. Preparation and process turn emergencies into routine fixes.
See all debugging guides