Preparing for your first 1000 users in a vibe coded app is the work of strengthening 12 specific systems that worked fine at 50 users and break in surprising ways at 1000. The transition is not about premature optimization, it is about removing the cheap bottlenecks that turn a successful launch into an outage. Most vibe coded apps hit a wall around 200 to 400 concurrent users because the AI generated code optimized for the happy path on a single laptop, not the reality of real traffic.
This checklist walks through what breaks first, in what order, and the smallest investment that fixes each system before it becomes the news.
Why 1000 Is the Right Threshold
For a small SaaS, 1000 users is the moment when the app stops being a personal demo and starts being a business. It is also the moment when most of the cheap bottlenecks become user-visible. Below 1000 users, your app probably works because traffic is light enough that bad code paths complete quickly. Above 1000 users, the same code paths queue up, retry, and cascade in ways that produce outages.
The threshold is not magic, it is the point where the math of concurrent requests times average latency starts to exceed the resources of any single server you are likely to have provisioned. A single Vercel function or DigitalOcean droplet can handle a surprising amount of traffic, but the curve bends sharply around the same time the app starts to feel popular.
A 2024 IndieHackers operational survey found that 67% of vibe coded apps experienced their first major outage between 200 and 800 concurrent users, and that 84% of those outages traced back to one of 12 specific systems. The list below covers all 12.
The pattern to copy is a small restaurant scaling its kitchen. The second dishwasher, the third burner, the larger walk-in fridge are all unnecessary at 30 covers a night and essential at 200. Doing them in the wrong order leaves the kitchen blocked. Doing them at the right time keeps service flowing.
The 12 Systems and Their Order
The order matters because each system upstream of another will be the bottleneck if not fixed first. Database before cache, auth before background jobs, monitoring before scaling.
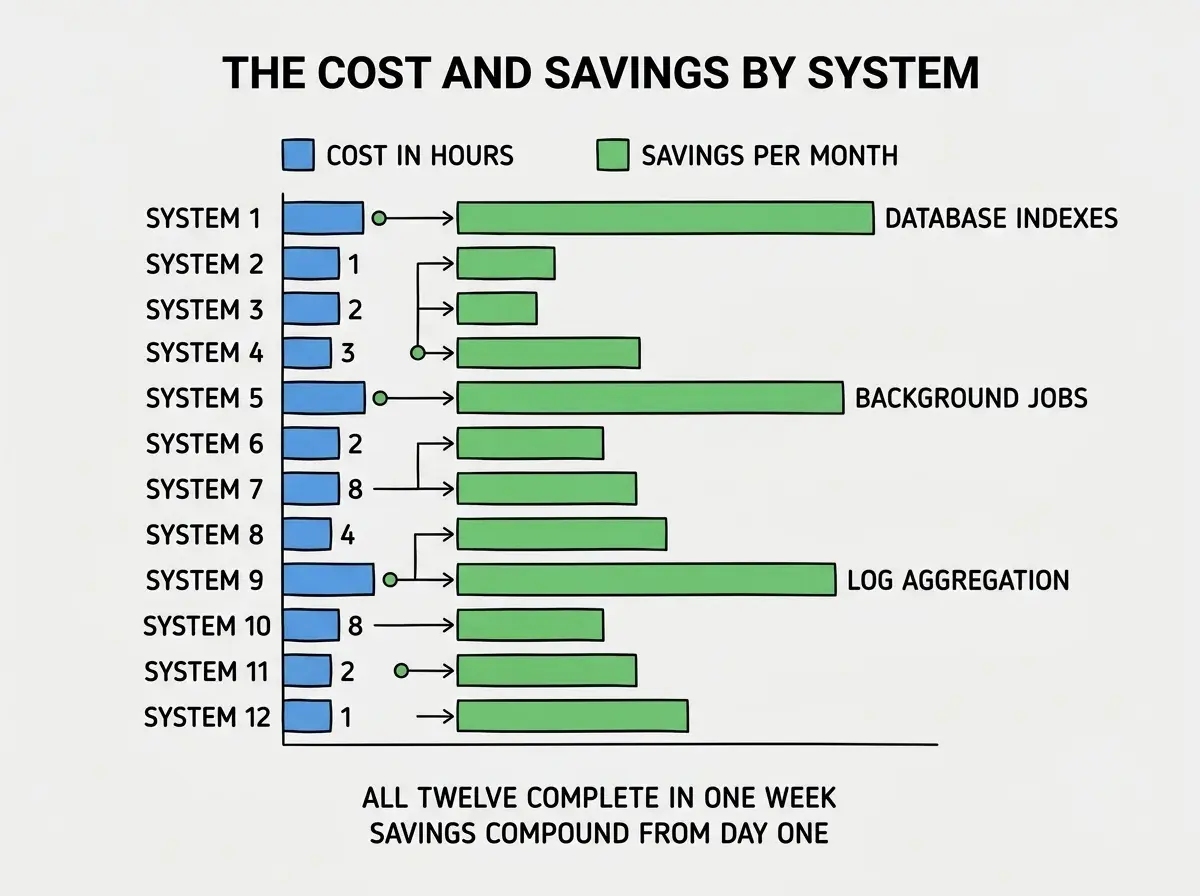
System 1, the database. The single biggest bottleneck for most apps is unindexed queries on tables that have grown to hundreds of thousands of rows. The fix is to add indexes on every column appearing in WHERE, JOIN, or ORDER BY clauses. Cost, an afternoon. Savings, every page load gets faster.
System 2, the connection pool. AI-generated code often opens database connections per request without pooling. At 1000 users this exhausts the database's connection limit and fails new requests. The fix is to wire up connection pooling (pgbouncer for Postgres, RDS Proxy for AWS, or your framework's built-in pooler). Cost, a couple of hours.
System 3, the cache layer. Repeated identical reads on the database waste resources. Add a simple read-through cache (Redis or your platform's edge cache) for the top 5 most-frequent reads. Cost, half a day. Savings, 70% to 90% of database load on read-heavy endpoints.
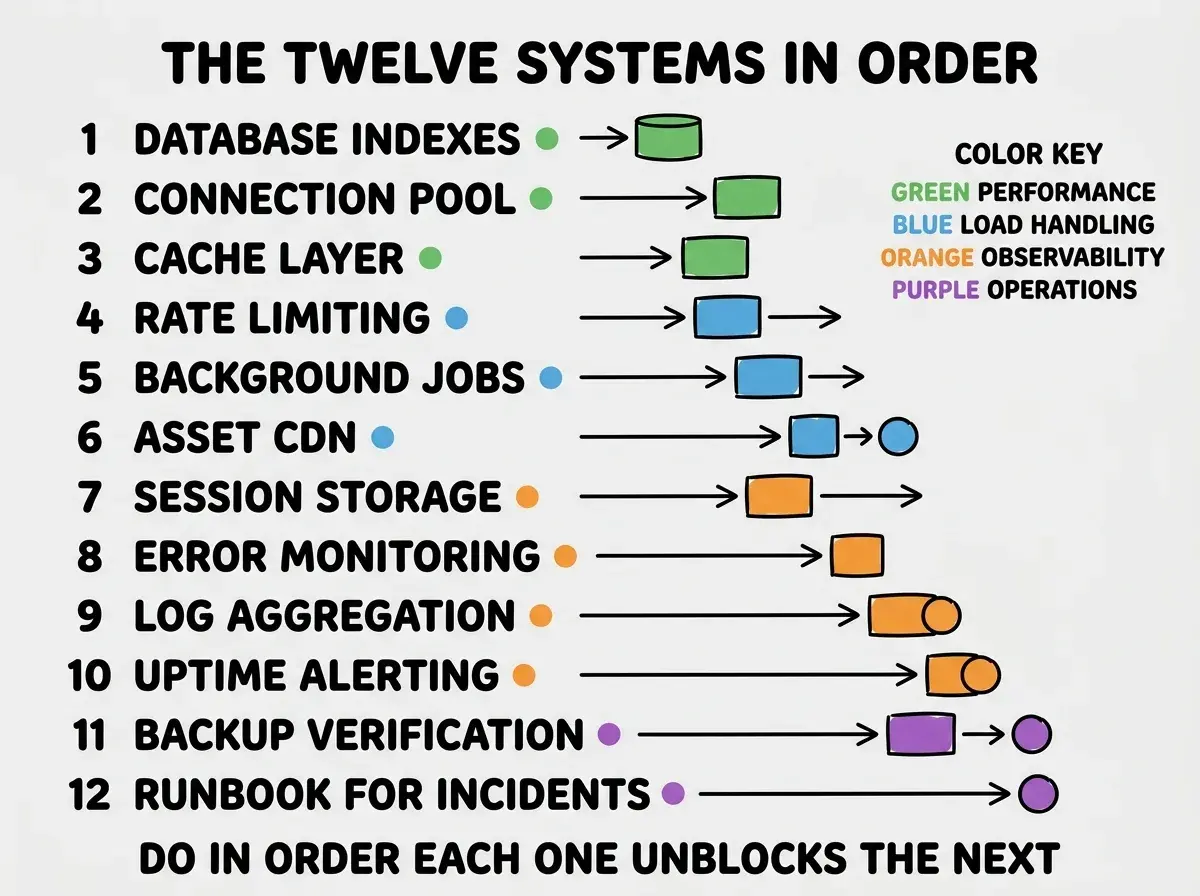
System 4, rate limiting. Without rate limits, a single misbehaving client can flood your server. Add per-IP and per-user limits on auth endpoints, signup, and any expensive endpoint. Cost, two hours. Savings, immune to most denial-of-service patterns.
System 5, background jobs. Slow operations (email sending, file processing, third-party API calls) blocking request handlers create cascading slowness. Move them to a background queue (Trigger.dev, Inngest, BullMQ). Cost, a day per job type. Savings, every page load is fast even when the heavy work is slow.
System 6, asset CDN. Images and static files served from your application server compete with API traffic for bandwidth. Move them to a CDN (Cloudflare, Vercel Edge, or your hosting provider's built-in option). Cost, hours. Savings, dramatic on global traffic.
The Observability Layer
Performance fixes only matter if you can see them working. The observability systems are the second tier of the checklist, and they pay for themselves the first time something breaks.
System 7, session storage. AI-generated auth often stores sessions in memory, which means a server restart logs everyone out. Move sessions to Redis or your database. Cost, a few hours. Savings, deploys stop being user-visible.
System 8, error monitoring. Without Sentry, Bugsnag, or equivalent, you only learn about errors when users complain. Set up error tracking with alerts on new error types. Cost, an hour. Savings, you catch problems before users do.
Read more growth-stage operations guides for vibe coded apps
Browse the grow categorySystem 9, log aggregation. Scattered logs across hosting platforms make debugging slow. Ship every service's logs to one searchable place (Better Stack, Axiom, Datadog). Cost, a few hours. Savings, debugging time drops by 4x.
System 10, uptime alerting. A monitor pinging your homepage every minute with SMS alerts is the cheapest insurance you can buy. Cost, fifteen minutes. Savings, you find outages in 5 minutes instead of 5 hours.
The Operational Layer
The last two systems are the ones every founder skips and every founder regrets. They are not technical problems, they are operational ones.
System 11, backup verification. Most managed databases auto-backup. Almost no founder has tested whether they can actually restore. Spend an hour restoring a backup to a staging database to confirm it works. Cost, an hour. Savings, untested backups are not actually backups.
System 12, a runbook for incidents. Write down what to do when database is down, when auth is broken, when payments fail. A one-page markdown file you can read at 3am is the difference between a 30-minute outage and a 4-hour one. Cost, two hours. Savings, every future incident is shorter.
The most expensive 1000-user mistake is doing the systems out of order. Adding background jobs before rate limiting means abusers can fill your job queue. Adding monitoring before fixing the database means you watch the same problem repeatedly without fixing it. The order is not arbitrary, it is the dependency graph.
The compounding return on completing the full list is enormous. An app that has all 12 systems in place at 1000 users will scale to 10,000 users with mostly the same architecture. An app missing four or five systems will hit a new outage at every doubling of traffic.
The other piece worth tracking is the order in which your traffic grows. Apps with mostly logged-in usage hit database limits first because every page load runs authenticated queries. Apps with mostly anonymous traffic hit CDN and rate limit issues first because static asset delivery and bot traffic dominate. Knowing which type of app you have changes which systems on the list need attention soonest. The same 12 systems matter, but the order shifts based on whether your bottleneck is the database or the edge.
What This Means For You
Preparing for 1000 users is a one-week project, not a quarter-long one. The work compounds, every system you fix early prevents a category of incident, and the cumulative effect at scale is dramatic.
- If you're a founder: Block one focused week on this list before your next launch. The first time you avoid an outage during a traffic spike, the discipline pays for itself.
- If you're changing careers: Working through this list on a small project is excellent preparation for the operational thinking senior engineering roles require.
- If you're a student: Pick any class project and intentionally simulate 1000 users with a load test tool. Watch what breaks. The lesson sticks better than reading.
Browse more growth and operations guides
Read more grow guides