Posthog vs Mixpanel vs Amplitude is the analytics decision every product builder faces once their app has real users. With 92% of developers using AI tools daily, shipping a functional product has never been faster. But shipping fast means you need to understand what users actually do inside your product even faster. The analytics platform you pick determines whether you get that understanding or just collect data that sits in a dashboard nobody checks.
Quick Verdict
| PostHog | Mixpanel | Amplitude | |
|---|---|---|---|
| Best for | Full ownership, all-in-one product toolkit | Event-deep analysis, growth teams | Behavioral research, enterprise product teams |
| Price | Generous free tier, self-host option | Free to 20M events/mo, then per-event | Free to 50K MTU, then per-user |
| Strength | Session replay + feature flags + analytics in one | Best-in-class event funnels and retention | Advanced cohort analysis, predictive analytics |
| Weakness | UI can feel overwhelming at first | No session replay, no feature flags | Expensive at scale, steeper learning curve |
Think of these three platforms like different types of dashcam. PostHog is the dashcam you own and keep the footage on your own hard drive. You control the recordings, the storage, and nobody else has access unless you allow it. Mixpanel is the fleet management camera that obsesses over every event on the road, timestamps and categorizes every turn, brake, and acceleration with surgical precision. Amplitude is the research-grade camera system with AI-powered analysis that can predict where collisions happen before they do. Same category of tool. Very different philosophies about who controls the data and what you do with it.
If you are a solo builder or early-stage indie hacker, PostHog's free tier gives you analytics, session replay, feature flags, and A/B testing in a single platform. You avoid stitching together three separate tools before you even have product-market fit. Start there unless you have a specific reason to pick something else.
How PostHog Works
PostHog is an open-source product analytics platform you can self-host or use as a cloud service. The self-hosted option runs on your own infrastructure, meaning user data never leaves your servers. The cloud version works like any other SaaS analytics tool but with the same open-source codebase running underneath.
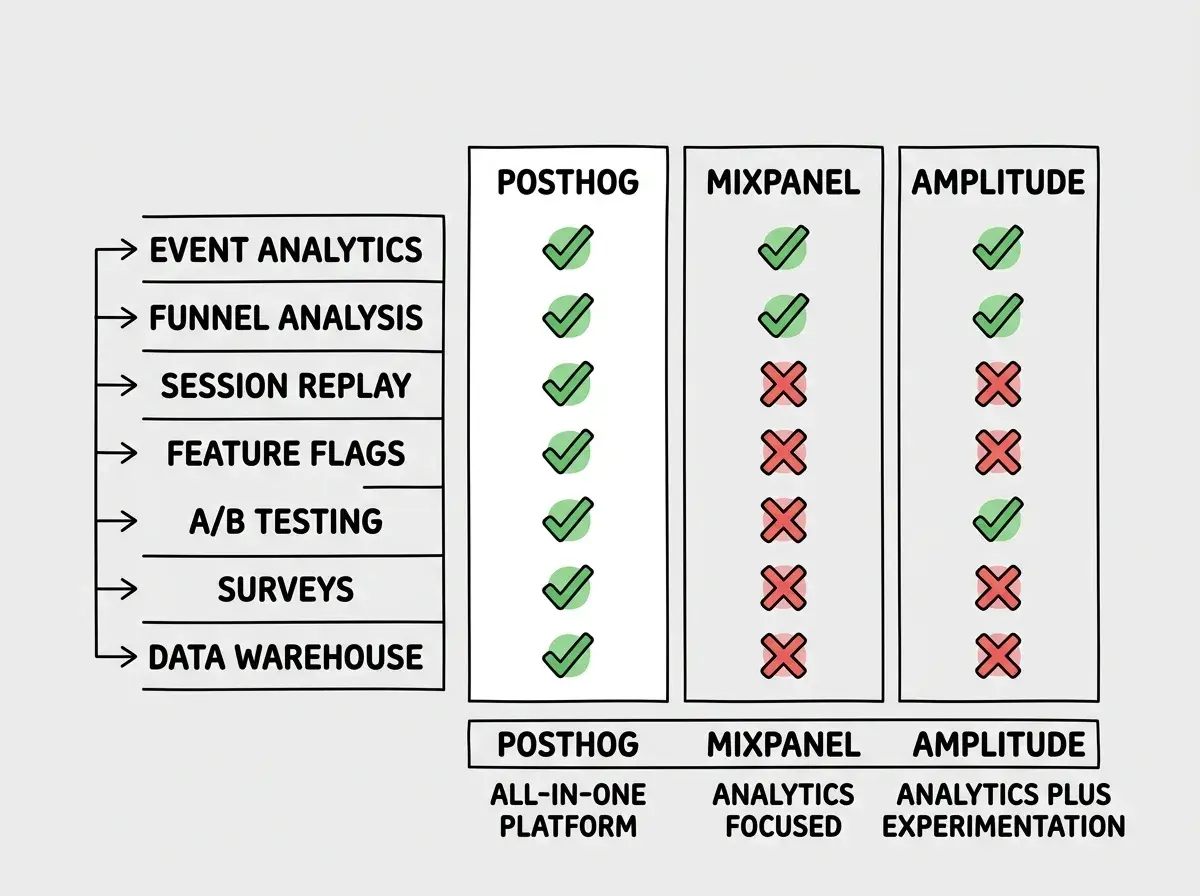
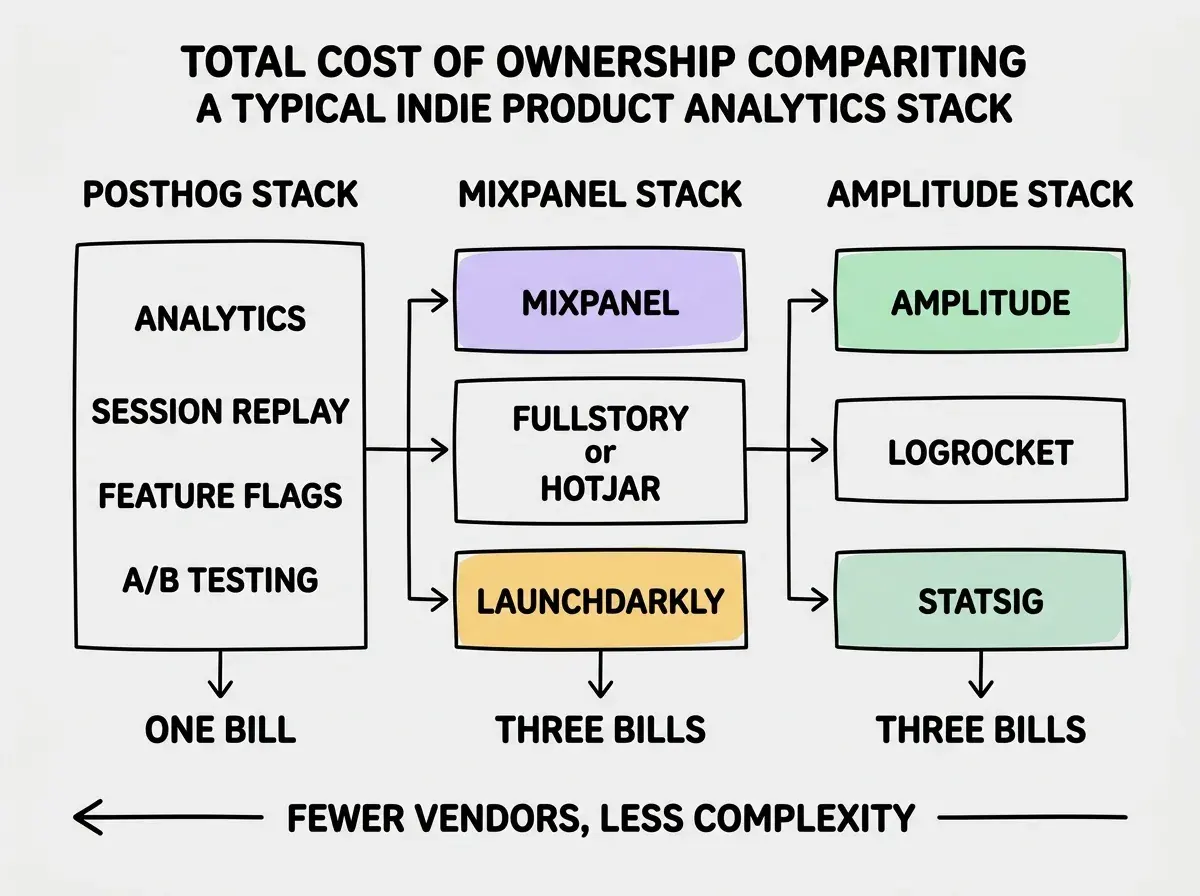
The all-in-one approach is the differentiator. Most analytics platforms give you event tracking and dashboards. PostHog bundles analytics, session replay, feature flags, A/B testing, surveys, and a data warehouse into one product. For a vibe-coded app that needs to understand user behavior, test new features safely, and watch real user sessions to debug issues, PostHog covers all of it without needing Mixpanel for analytics plus LaunchDarkly for feature flags plus FullStory for session replay.
Session replay alone is worth the setup. Watching a real user struggle with your onboarding flow teaches you more in five minutes than a week of staring at funnel charts. PostHog records sessions with configurable privacy controls and links them directly to the analytics events, so you can see a user drop off in your funnel and then watch exactly what happened. Neither Mixpanel nor Amplitude offers this natively.
Self-hosting means data sovereignty. If you are building in healthcare, fintech, or any regulated space, keeping analytics data on your own servers is not a preference. It is a compliance requirement. PostHog on your own infrastructure solves this without the enterprise sales call that Amplitude requires for their on-premise option.
The tradeoff is complexity. PostHog's UI packs a lot of features into one interface. New users sometimes feel overwhelmed by the number of tools available. The learning curve is steeper than Mixpanel's focused interface, and self-hosting adds operational burden that cloud-only platforms eliminate entirely.
How Mixpanel Works
Mixpanel is a cloud-only event analytics platform built for understanding user behavior through events. Every action a user takes becomes an event with properties. Clicked a button, viewed a page, completed a purchase, each one gets tracked with metadata attached. Mixpanel then lets you build funnels, retention charts, and flow diagrams from those events.
Event tracking depth is where Mixpanel excels. The query builder for funnels and retention is fast, intuitive, and handles complex multi-step analyses without lag. If you want to know "what percentage of users who signed up on mobile completed onboarding within 48 hours and then invited a teammate," Mixpanel answers that question with a few clicks. The interface is clean and focused because Mixpanel does one thing and does it exceptionally well.
The free tier is genuinely generous. Mixpanel gives you 20 million events per month for free. For most indie projects and early-stage products, that is effectively unlimited. You will not hit that ceiling until your product has serious traction, which is exactly when you should be willing to pay for analytics.
No session replay, no feature flags. The dashcam analogy holds here. Mixpanel captures every event on the road in granular detail but does not record video of the drive. You see the data points but not the human context behind them. If you need session replay, you add a separate tool. If you need feature flags, same story. Mixpanel is excellent at its core job and does not pretend to be a platform for everything else.
How Amplitude Works
Amplitude is a product analytics platform built for behavioral analysis at scale. It shares Mixpanel's focus on event-based analytics but adds a layer of machine learning and predictive capabilities on top. Amplitude can identify behavioral patterns that correlate with retention, predict which users are likely to churn, and surface insights that manual analysis would miss.
Behavioral cohorts are the standout feature. Amplitude lets you define cohorts based on sequences of actions, not just individual events. "Users who viewed pricing three times in a week but did not start a trial" becomes a targetable segment. You can sync these cohorts to your marketing tools and run campaigns against them. For product-led growth teams, this capability drives real revenue.
The learning curve is the steepest of the three. Amplitude's interface has more options, more chart types, and more configuration than Mixpanel. A product manager who knows exactly what questions to ask will love the depth. Someone who just wants to see basic usage metrics may feel lost. The research-grade dashcam produces stunning footage, but you need training to operate it.
Pricing gets expensive fast. Amplitude's free tier covers 50,000 monthly tracked users (MTU). Beyond that, pricing is custom and typically requires a sales conversation. Enterprise contracts routinely run $30,000-50,000+ per year. For indie hackers and small teams, Amplitude is often overkill both in capability and in cost.
Choosing Amplitude because it is the "most powerful" option without having the team or workflow to use its advanced features. Predictive analytics and behavioral cohorts only matter if someone on your team is building experiments around them. For a solo builder, Amplitude's depth becomes unused complexity that you pay for every month. Start with a simpler tool and graduate to Amplitude when your team and product maturity demand it.
Pricing at Scale
The cost comparison shifts significantly as your product grows.
| Monthly Events/Users | PostHog (Cloud) | Mixpanel | Amplitude |
|---|---|---|---|
| Getting started | 1M events free/mo | 20M events free/mo | 50K MTU free |
| 10M events/mo | ~$0 (within free tier) | $0 | Custom pricing |
| 50M events/mo | ~$450/mo | ~$834/mo | Custom (typically $2K+/mo) |
| 100M events/mo | ~$800/mo | ~$1,500/mo | Custom (typically $4K+/mo) |
| Self-hosted | $0 (your infra costs) | Not available | Not available |
PostHog's self-hosted option is the wildcard in this comparison. If you have the infrastructure knowledge (or an AI tool that can set up Docker for you), running PostHog on a $50/mo server gives you unlimited events with zero per-event pricing. The tradeoff is operational maintenance, but for budget-conscious builders, self-hosting is a legitimate strategy that neither Mixpanel nor Amplitude can match.
Mixpanel's 20 million free events per month is the most generous cloud-only free tier. Most products under 10,000 daily active users will never exceed this. If you want cloud analytics with zero cost, Mixpanel's free tier is hard to beat.
Analytics only matters if your product works. Start with the fundamentals.
Read the launch guideFeature Flags and Session Replay
These two capabilities often tip the decision for teams choosing between PostHog and the other two.
Feature flags let you roll out new features to a percentage of users, test different experiences, and instantly kill a broken release without deploying new code. PostHog includes this natively. With Mixpanel or Amplitude, you need a separate service like LaunchDarkly ($10/seat/mo+) or Statsig. For a solo builder, adding another tool and another bill for feature flags feels wasteful when PostHog includes it.
Session replay lets you watch recordings of real user sessions. PostHog records sessions and links them to analytics events. You can click on a user who dropped off in a funnel and immediately watch their session to understand why. This feedback loop between quantitative data (they dropped off) and qualitative data (here is exactly what happened) accelerates product decisions in a way that pure event analytics cannot.
Neither Mixpanel nor Amplitude offers native session replay. You would need to add Hotjar, FullStory, or LogRocket as a separate tool, which means separate billing, separate user identification, and the overhead of keeping two systems in sync.
Which Platform Fits Your Situation
Solo builder shipping an MVP. PostHog. The free tier covers analytics, session replay, and feature flags. You avoid vendor sprawl before you even know if the product will work. Self-hosting is optional but available if data ownership matters to you.
Growth-stage product with a dedicated PM. Mixpanel. The event analysis depth is unmatched for someone who spends their day building funnels, analyzing retention, and optimizing conversion. The 20M free events mean you will not pay anything until the product has real scale.
Enterprise product team with data science resources. Amplitude. The behavioral cohorts, predictive analytics, and machine learning features justify the higher price when you have people who will actually use them. If your team runs weekly experiment reviews and builds targeting campaigns from behavioral segments, Amplitude pays for itself.
Regulated industry with compliance requirements. PostHog self-hosted. No other option gives you full data sovereignty with a mature analytics platform. You control where the data lives, who has access, and how long it is retained.
Analytics is one piece of the puzzle. See how the rest fits together.
Explore the full toolkitWhat This Means For You
The analytics decision is really a question about how much of your product infrastructure you want to own versus rent.
PostHog is the dashcam you buy, install, and keep the footage on your own terms. It does more than the others out of the box, costs less at scale, and gives you full control over your data. The tradeoff is a busier interface and optional self-hosting complexity.
Mixpanel is the fleet management camera that captures every event with precision and makes it effortless to analyze. It does one thing brilliantly and charges fairly for it. If event analytics is all you need, Mixpanel's focus is an advantage, not a limitation.
Amplitude is the research-grade system that surfaces patterns humans would miss. It is the right choice when your team has the sophistication to act on predictive insights and the budget to match.
For most indie hackers and solo builders reading this, PostHog is the pragmatic starting point. You get a complete product analytics toolkit at zero cost, avoid stitching together three separate vendors, and keep the option to self-host if your needs evolve. You can always migrate to a specialized tool later when you know exactly what kind of analysis your product demands. But starting with everything in one place beats starting with three dashboards and no idea which one to check first.