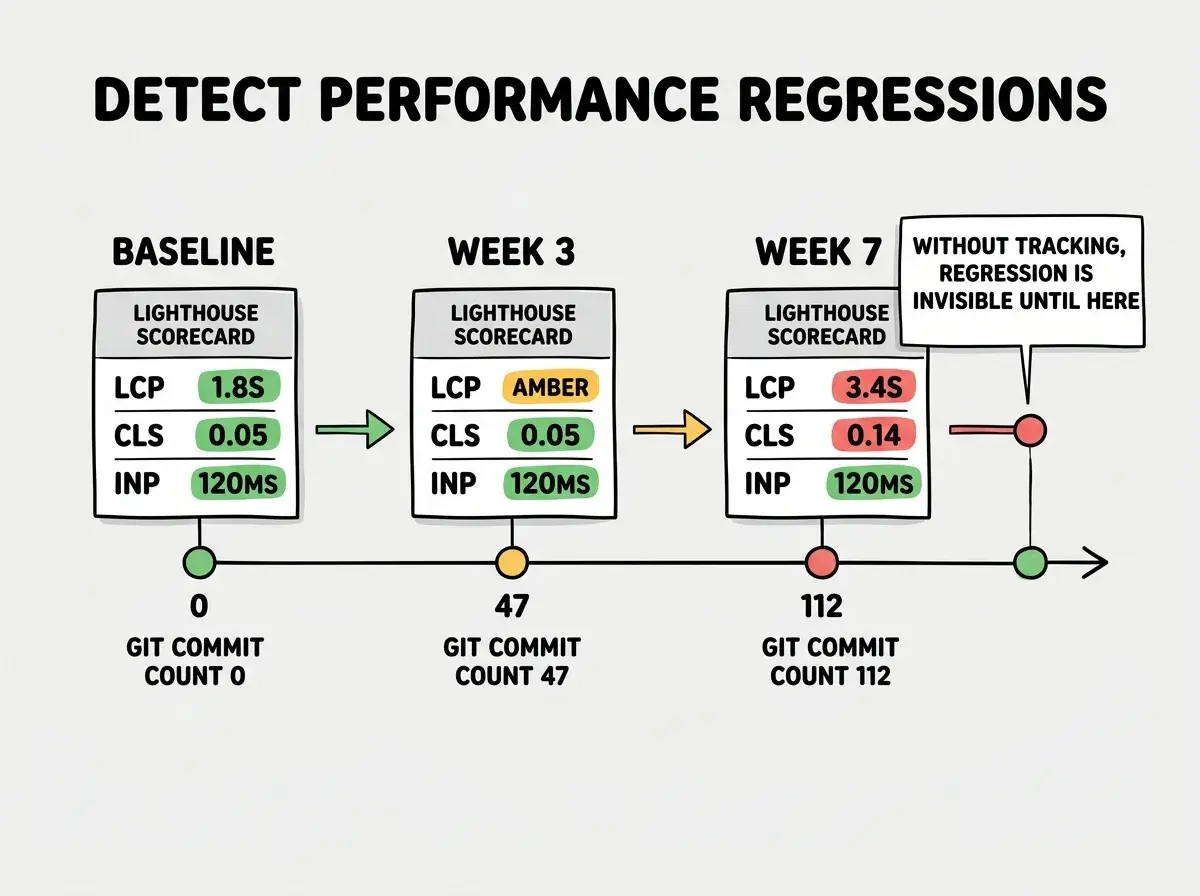
Performance regression detection is the practice of automatically comparing your app's speed today against a known-good baseline and alerting when it gets slower. Without it, AI-built apps degrade silently: a new dependency here, a slightly heavier component there, and six months later your LCP has doubled and you have no idea when it happened.
AI coding tools accelerate this problem. When you ship code daily using Claude, Cursor, or Copilot, each session might add a library the AI considered convenient without checking its bundle size. Three convenience packages later, your Time to First Byte (TTFB) is creeping up and your Core Web Vitals score is slipping. Users notice before you do. A 100ms increase in LCP correlates with a 1% drop in conversion; at scale, that is real money.
This post gives you the exact setup to catch regressions before they cost you users or revenue.
Why AI-Built Apps Regress Faster
Every time you prompt an AI tool to "add authentication" or "fix the search feature," the model picks the approach it has the most training signal on. That usually means pulling in a well-known package rather than writing a lean custom implementation. The result is reliable and functional, but not always minimal.
A few patterns that degrade performance specifically in AI-generated code:
Unnecessary dependencies. An AI might import lodash for one array operation or moment.js for a single date format. Each one adds to your JavaScript bundle. moment.js alone weighs 329kB uncompressed. Lighthouse will flag large bundles, but only if you are running Lighthouse.
Unoptimized images. AI tools wire up image display correctly but rarely add the loading="lazy" attribute, fetchpriority="high" for the LCP element, or explicit width/height dimensions to prevent Cumulative Layout Shift (CLS). Every missing attribute is a small regression.
Client-side hydration bloat. Components that could be server-rendered often end up as client components because the AI adds "use client" to avoid hydration errors. This shifts JavaScript to the browser unnecessarily, hurting First Input Delay (FID) and Interaction to Next Paint (INP).
None of these is catastrophic in isolation. The compounding effect over dozens of AI-assisted commits is what kills performance.
Setting Up Performance Baselines
A baseline is a snapshot of your app's performance on a specific build that you declare "good enough." Everything after that gets compared against it.
The four Core Web Vitals metrics to track are:
- LCP (Largest Contentful Paint): How long until the main content renders. Target under 2.5 seconds.
- FID (First Input Delay) / INP (Interaction to Next Paint): How responsive the page feels to clicks. Target FID under 100ms; INP under 200ms.
- CLS (Cumulative Layout Shift): How much the layout jumps while loading. Target under 0.1.
- TTFB (Time to First Byte): How fast your server responds. Target under 800ms.
To establish a baseline, run Lighthouse three times on your production URL and average the results. Lighthouse's numbers vary between runs because of network jitter; a three-run average is more stable than a single reading.
npx lighthouse https://your-app.com --output json --output-path ./baseline.json
Save that JSON. It is your performance contract. Every future build should meet or beat these numbers.
Automated Performance Monitoring
Running Lighthouse manually is better than nothing, but regressions slip through between runs. Automated monitoring catches them on every deploy or on a scheduled cadence.
Lighthouse CI (free, self-hosted) is the open-source tool built specifically for this. It runs Lighthouse as part of your CI pipeline and can fail a build when scores drop below your thresholds. Setup takes about 20 minutes.
Install the CLI: npm install -g @lhci/cli. Add an lighthouserc.js config file at your project root:
module.exports = {
  ci: {
    collect: {
      url: ['https://your-app.com', 'https://your-app.com/dashboard'],
      numberOfRuns: 3,
    },
    assert: {
      preset: 'lighthouse:recommended',
      assertions: {
        'largest-contentful-paint': ['error', { maxNumericValue: 2500 }],
        'cumulative-layout-shift': ['error', { maxNumericValue: 0.1 }],
        'total-blocking-time': ['warn', { maxNumericValue: 300 }],
      },
    },
    upload: {
      target: 'temporary-public-storage',
    },
  },
};
Add lhci autorun to your GitHub Actions workflow after the build step. Any deploy that pushes LCP past 2.5 seconds will fail the CI check before it reaches production.
SpeedCurve ($20/month for up to 5 pages, billed monthly) offers a hosted alternative with a polished UI, historical charts, and filmstrip comparisons. You define your pages once, set a monitoring schedule (every 6 hours, every hour, or on deploy via webhook), and SpeedCurve runs synthetic tests from real browsers in data centers around the world. The historical charts make regressions visually obvious. A flat LCP line that suddenly jumps on a specific date is trivial to cross-reference with your git history.
Calibre ($99/month for the Starter plan) is the premium option for teams who need performance budgets, automated Slack alerts, and per-page breakdowns with waterfall charts. It integrates directly with GitHub pull requests and leaves a comment showing performance impact before you merge. At $99/month it is priced for teams with SLA commitments, not solo founders; but if a 200ms LCP regression costs you $1,000/month in lost conversions, the math works.
Lighthouse CI is free and catches most regressions before they reach production. Start there. Add SpeedCurve at $20/month when you need multi-region historical data. Calibre makes sense once your team is merging pull requests daily and you want per-PR regression reports. The tier you need is determined by how often you ship, not by how big your company is.
Building Alerts That Actually Help
The mistake most teams make is setting alerts so sensitive they become noise. Every other deploy triggers a warning. Engineers learn to ignore them. When a real regression hits, it goes unnoticed in a sea of false positives.
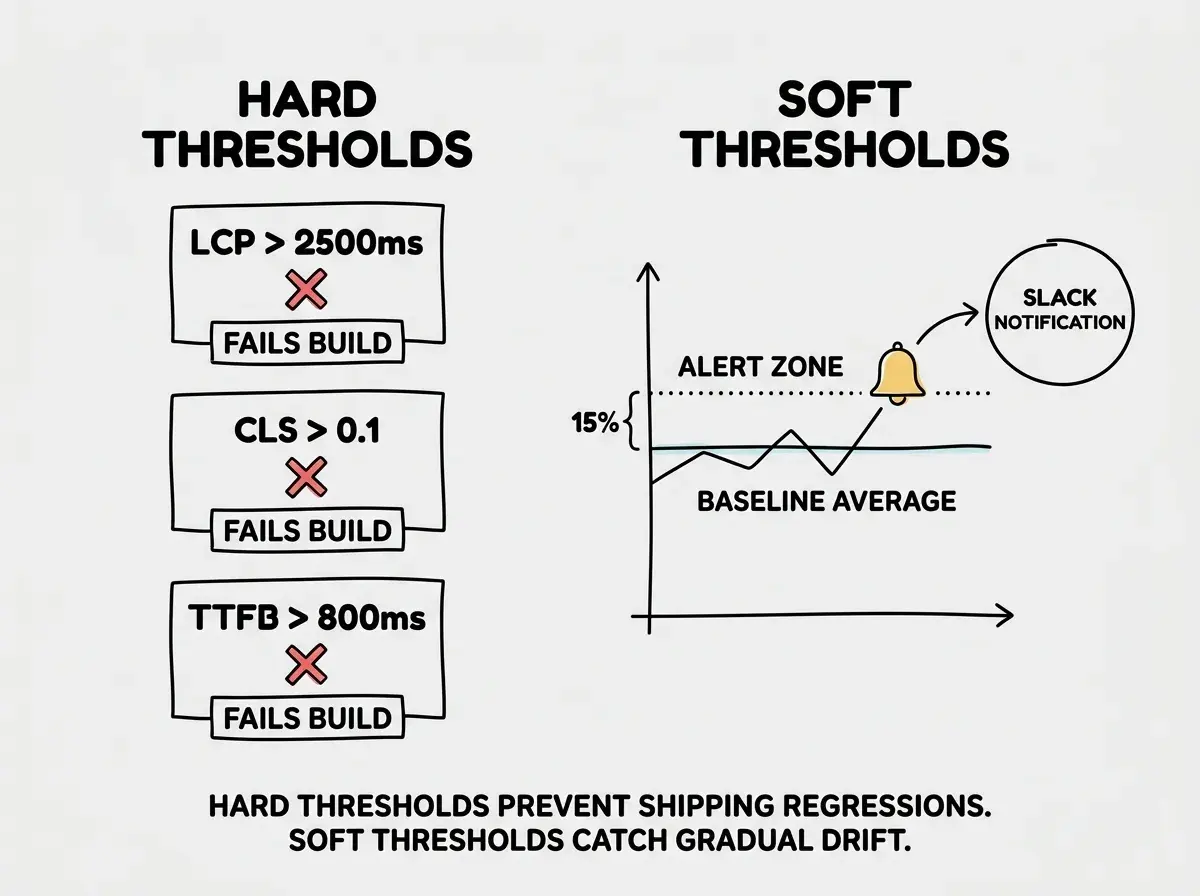
Build alerts with two thresholds.
Hard thresholds (fail the build): LCP over 2.5s, CLS over 0.1, TTFB over 800ms. These are the Google Core Web Vitals pass/fail cutoffs. Crossing them affects your search ranking and signals a genuine user-experience problem.
Soft thresholds (notify in Slack): Any single metric degrading more than 15% from the prior week's average. This catches gradual drift that stays under hard limits. An LCP moving from 1.8s to 2.1s to 2.4s never triggers the hard limit, but the 33% cumulative increase matters.
For Lighthouse CI, the config above handles hard thresholds. For soft thresholds, SpeedCurve has built-in budget alerts you can route to Slack. In Calibre, set a "performance budget" per metric and it will comment on any PR that exceeds the budget.
One practical tip: track performance separately by page type. Your homepage and your app dashboard have completely different characteristics. Grouping them in a single aggregate score hides problems. A bloated dashboard that only authenticated users see can drag down your overall score while your marketing pages (the ones that matter for SEO and acquisition) look fine, or vice versa.
Measuring performance only from your own machine or from one geographic location. A page that loads in 800ms in San Francisco might take 3.5 seconds in Southeast Asia. Run synthetic tests from at least three regions: one in North America, one in Europe, and one in Asia-Pacific. SpeedCurve and Calibre both support multi-region testing. Lighthouse CI can be extended with custom runners in different cloud regions using self-hosted GitHub Actions runners. If your user base is global and your tests are local, your baselines are measuring the wrong thing.
What This Means For You
Performance regression detection is not optional if you are shipping with AI tools every day. The velocity that makes vibe coding powerful is exactly what makes incremental degradation inevitable without automated checks.
If you are a founder or indie hacker: Set up Lighthouse CI today. Free, 20 minutes, and it will catch the next time a new package sends your bundle size to the moon. The $20/month SpeedCurve plan is worth it once you have paying users who would churn if the app got noticeably slower.
If you are a senior developer leading a team: Calibre at $99/month pays for itself the moment it catches a single pull request that would have regressed LCP by 400ms. Add it to your CI pipeline and make the per-PR comment the default; developers learn to think about performance impact when they see it reflected back on their own pull requests.
If you are a career changer or student building a portfolio: Lighthouse CI on a free GitHub Actions runner costs nothing and signals to interviewers that you understand production engineering, not just feature shipping. Set your LCP threshold to 2.5 seconds and make every project pass it before you share the URL.
The goal is simple: know your numbers, track them automatically, and get alerted when they move. Every week you run AI-assisted sessions without that system in place is a week of silent regressions you will eventually have to debug from scratch.
See the full production checklist covering monitoring, alerting, and performance for apps built with AI tools.
View the production checklistThe teams shipping the most durable AI-built apps are not the ones who write the fastest code. They are the ones who built the feedback loops to know when fast became slow. Performance budgets, automated Lighthouse runs, and a weekly alert on CLS drift are the unsexy infrastructure that lets you keep shipping without breaking what already works.
Get practical deep-dives on operations, monitoring, and scaling for apps built with AI coding tools.
Explore the blog