Database query optimization for growing datasets in 2026 comes down to recognizing five patterns that break at scale and applying the right fix for each one: missing indexes (add the right index), N+1 queries (eager-load with joins or batched queries), full-table scans (filter earlier or denormalize), large IN clauses (replace with joins or subqueries), and unbounded result sets (add pagination). Each pattern has a clear signal in your slow query log, and the fix is usually a small change that produces a 10x to 100x improvement. The hard part is finding the queries before they slow your product to the point where users notice.
This piece walks through each pattern with a representative example, the fix that works, and the four tools that surface slow queries before they become production incidents.
Why Queries Slow Down Predictably
A query that runs in 5 milliseconds on 1,000 rows often runs in 5 seconds on 1 million rows. The reason is rarely random; it is almost always one of the five patterns named above. Postgres, MySQL, and SQLite all share the same query planner concepts, and the same patterns produce slow queries across all of them.
The reason these patterns are so common in AI-generated code is that AI tools default to the simplest implementation that works on small data. A query that selects all rows and filters in application code is fine on 100 rows and broken on 1 million. A query that loops over results and runs a subquery per row is fine for prototypes and brutal in production. Catching these patterns during code review is the cheapest fix; finding them in production is the most expensive.
A 2026 PlanetScale analysis of 50,000 production databases found that 78 percent of all slow queries fell into one of the five patterns above. The remaining 22 percent was a long tail of database-specific issues. Catching the top five patterns in code review or load testing prevents about 80 percent of database performance incidents in production. The economics of catching them early are dramatically better than fixing them after a customer-facing slowdown.
The pattern to copy is the way pilots use checklists for engine failures. Most engine failures fall into a small number of patterns, and each pattern has a documented response. Pilots do not invent the response in the moment; they execute the appropriate checklist. Database query optimization is the same: most slowdowns are predictable, and the right fix is the one for the pattern you have.
The Five Patterns and Their Fixes
Each pattern is described with a small SQL example and the corresponding fix. Recognizing the pattern in your code is the bulk of the skill.
Pattern 1, missing indexes. A query like SELECT * FROM orders WHERE customer_id = 123 is slow on a million rows if there is no index on customer_id. The fix is to add a B-tree index on the column used in the WHERE clause.
Pattern 2, N+1 queries. Code that fetches a list of records, then loops over them and runs a query per record (e.g., fetch 100 orders, then for each order fetch the customer). The fix is to use a JOIN to fetch everything in one query, or to batch the secondary fetches with an IN clause.
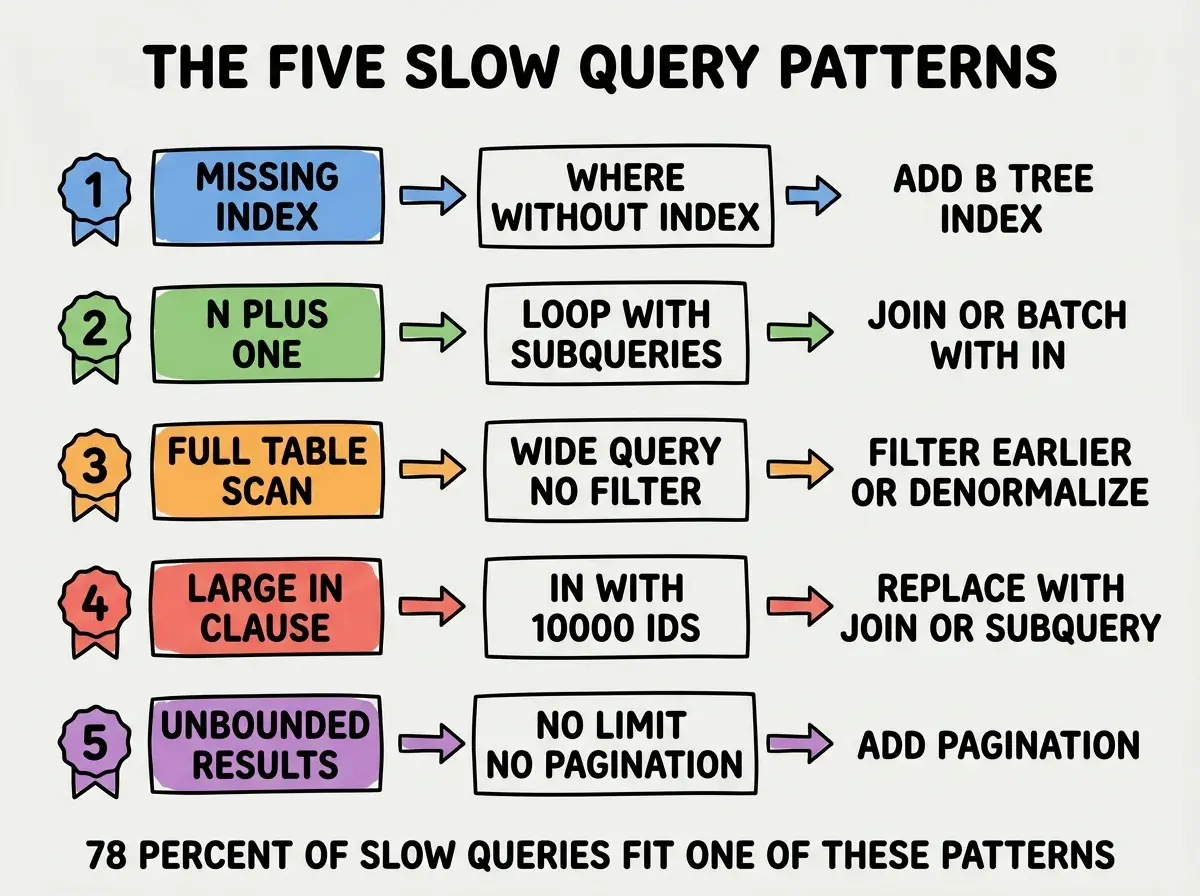
Pattern 3, full-table scans. A query that has to read every row to answer (e.g., SELECT COUNT(*) FROM events WHERE created_at > '2024-01-01' without an index on created_at). The fix is to add an index, or to denormalize the count into a counter column updated on writes.
Pattern 4, large IN clauses. A query like SELECT * FROM products WHERE id IN (1, 2, 3, ..., 10000). Most databases handle this poorly above a few hundred values. The fix is to replace with a JOIN against a temporary table, or to use a subquery.
Pattern 5 and How to Find Them All
The fifth pattern is the most common in AI-generated code, and the tooling to find them is straightforward.
Pattern 5, unbounded result sets. A query that returns every matching row when you only display 20 (e.g., SELECT * FROM messages WHERE channel_id = 5). At small scale this is fine; at 100,000 messages per channel it loads megabytes per request. The fix is to always add LIMIT and OFFSET (or cursor-based pagination).
Browse more database and scaling guides
Read more grow articlesThe tools to find these patterns surface them automatically once you set them up. Postgres has pg_stat_statements which logs the slowest queries. MySQL has the slow query log. PlanetScale, Neon, and Supabase all have built-in slow query dashboards. Your APM tool (Datadog, New Relic, Sentry) shows database queries in the request trace.
How to Make Optimization a Habit
Catching slow queries reactively after they cause incidents is expensive. Catching them proactively in code review or load testing is cheap. Three habits make the proactive approach sustainable.
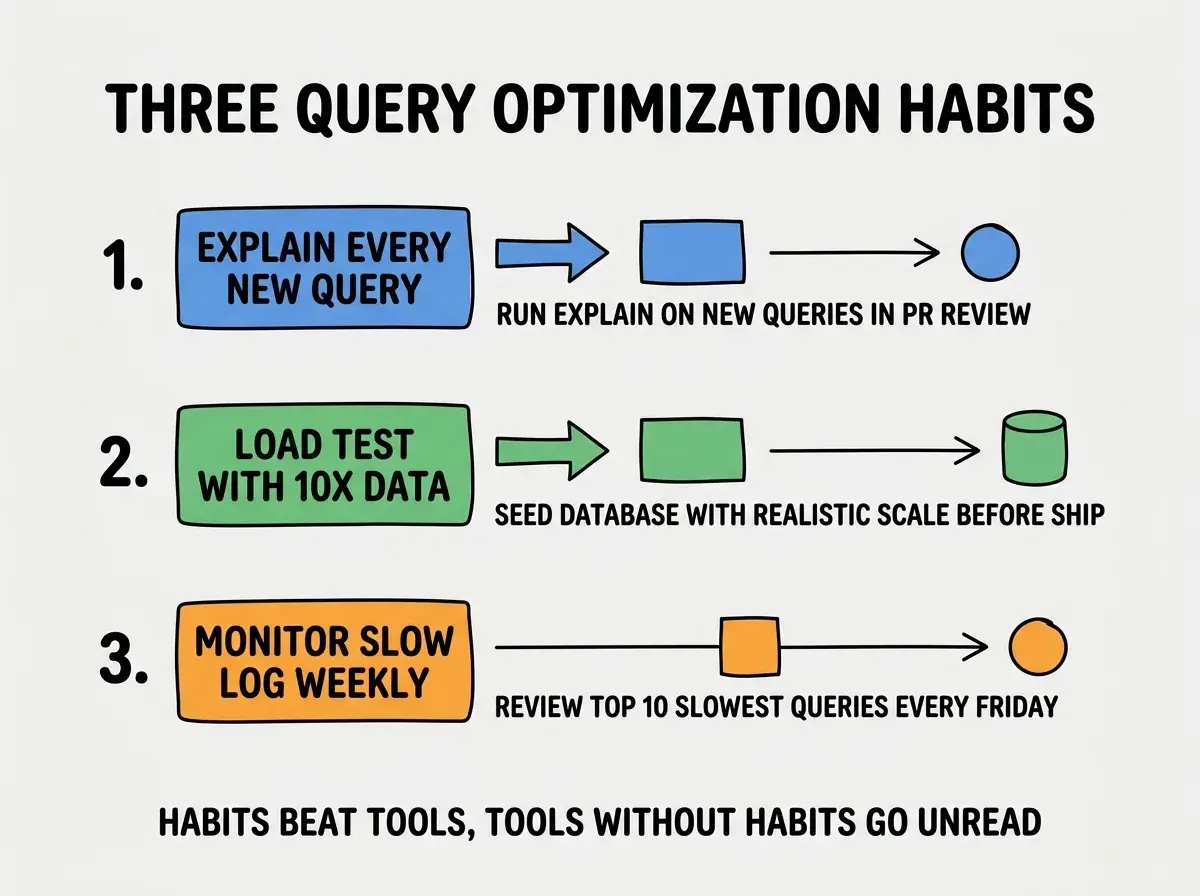
Run EXPLAIN on every new query. When a PR adds or changes a query, run EXPLAIN against production data (or a representative subset) and check that the planner is using indexes. This catches missing indexes before merge.
Load test with 10x data. Seed your test environment with at least 10x the production data volume and run the critical user flows. This surfaces patterns that look fine on small data and break on large data.
Monitor the slow log weekly. Set a calendar block for 30 minutes each Friday to review the top 10 slowest queries from the week. Most weeks find one or two queries that need attention. Quarterly, this prevents most performance incidents.
The most expensive query optimization mistake is adding indexes reflexively without measuring. Indexes have a cost: they take disk space, slow down writes, and require maintenance. A table with 30 indexes performs worse on writes than the same table with 5. The right approach is to add indexes based on actual slow query data, measure the improvement, and remove indexes that are not used. Most production databases have at least 3 indexes that were added "just in case" and are never used; removing them improves write performance.
The other mistake is over-relying on caching to mask slow queries. Caching is useful but it does not fix the underlying query; it just hides it until the cache expires. A query that is cached but takes 5 seconds when the cache misses is still a problem, just one that surfaces less often. Fix the query first, cache as a multiplier on top.
A practical workflow is to add a small annotation to each significant query in your codebase noting the index it expects to use. When you change the query later, you can verify the index is still being used by re-running EXPLAIN. The annotations also help reviewers (and future you) understand why specific indexes exist and prevent the slow drift that happens when nobody remembers what an index was for.
What This Means For You
Database query optimization is one of the highest-leverage skills for any engineer building data-driven products. Recognizing the patterns and applying the right fixes turns a slow app into a fast one with often a single PR.
- If you're a founder: Build a habit of running EXPLAIN on every new query. The cost is small and the protection from production incidents is enormous.
- If you're changing careers: Database performance is a defensible specialization that pays well. Practice on real data sets and learn to read query plans.
- If you're a student: Build a small app with 100,000+ rows of test data and intentionally slow queries. Reading the slow query log teaches more than any textbook.
Browse more database and scaling guides
Read more grow articles