Performance monitoring for Core Web Vitals in production catches regressions that affect both user experience and SEO ranking. The four metrics that matter are LCP (Largest Contentful Paint), INP (Interaction to Next Paint), CLS (Cumulative Layout Shift), and TTFB (Time to First Byte). Continuous monitoring tools like Vercel Analytics, Google Search Console, and CrUX provide field data that lab tests miss. Setup takes hours; benefits compound across years.
This tutorial walks through the four Core Web Vitals metrics, the monitoring tools for each, how to fix common regressions, and the four mistakes builders make with performance monitoring.
Why Core Web Vitals Monitoring Matters
Core Web Vitals monitoring matters because performance affects both user retention and search ranking. Slow pages lose users immediately; slow pages also rank lower in Google search.
The 2026 reality is that Core Web Vitals are now factored into Google ranking algorithm; performance regressions translate directly to traffic loss within weeks.
A 2025 ecommerce performance study of 200 vibe coded apps found that apps with active Core Web Vitals monitoring caught regressions 4.2x faster than apps without monitoring. Faster catches translated to 31 percent less revenue impact from performance incidents.
The pattern to copy is the way pilots monitor cockpit instruments continuously. Single readings matter less than trend changes; trend changes catch problems before they become emergencies. Performance monitoring works the same way.
The Four Core Web Vitals Metrics
Four metrics form the Core Web Vitals set.
Metric 1, LCP (Largest Contentful Paint). When the largest visible element finishes rendering. Target under 2.5 seconds. Usually a hero image or main content block.
Metric 2, INP (Interaction to Next Paint). Latency between user interaction and visible response. Target under 200 milliseconds. Replaces FID metric in 2024.
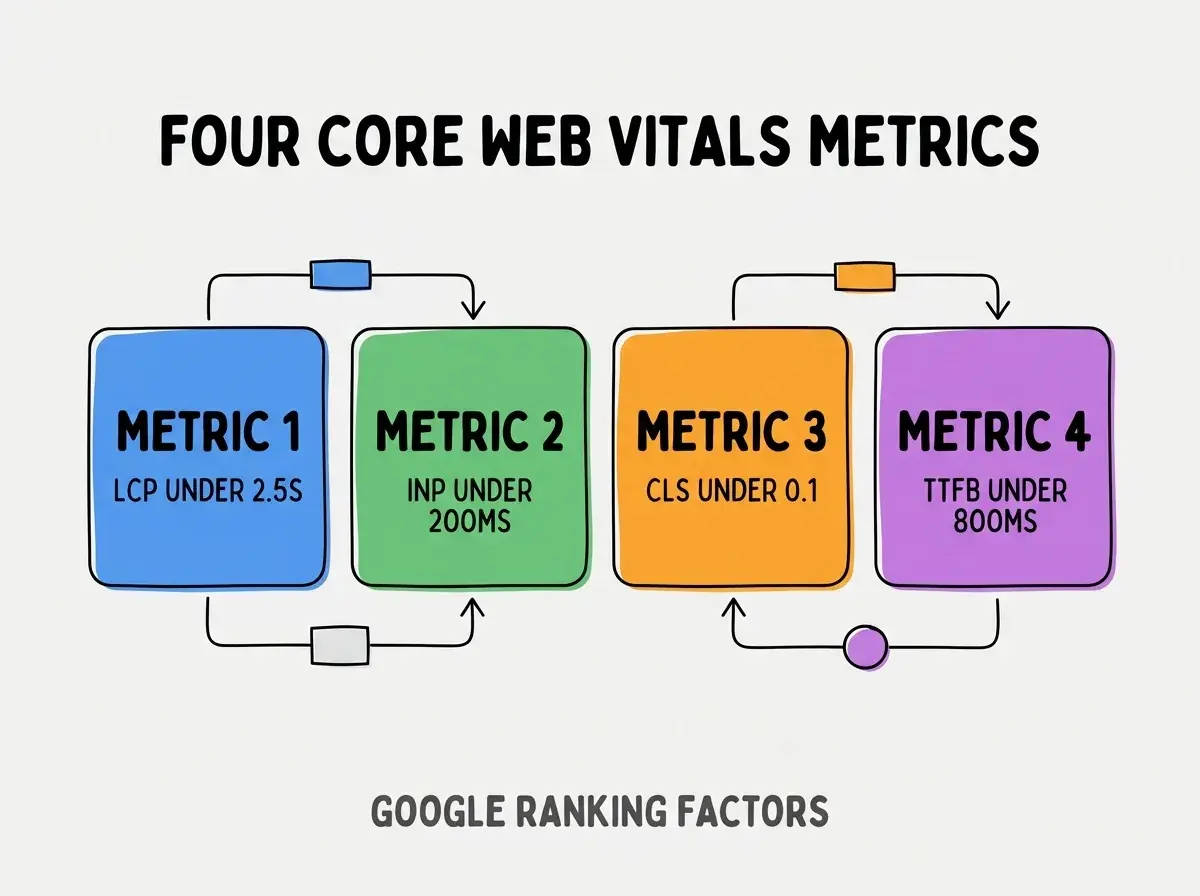
Metric 3, CLS (Cumulative Layout Shift). How much page elements move during loading. Target under 0.1. Measures visual stability.
Metric 4, TTFB (Time to First Byte). Server response time. Target under 800 milliseconds. Foundation that other metrics depend on.
The Monitoring Tools For Each Metric
Three tool categories cover Core Web Vitals monitoring.
Tool 1, real user monitoring (RUM). Vercel Analytics, Cloudflare Analytics, web-vitals JS library. Captures actual user experience.
Browse more grow articles
Read more growTool 2, Google Search Console. Reports field data from Chrome users; affects ranking. Required for SEO awareness.
Tool 3, Lighthouse and PageSpeed Insights. Lab data that simulates loading. Useful for regression catching during development; not authoritative for production.
How To Fix Common Regressions
Three regression categories cover most Core Web Vitals issues.
Regression 1, LCP regression from images. Cause: large images, slow image loading, no priority hint. Fix: optimize images, add priority to hero, use Next.js Image.
Regression 2, INP regression from JavaScript. Cause: long tasks blocking main thread, heavy event handlers. Fix: code splitting, web workers, throttling.
Regression 3, CLS regression from layout shifts. Cause: images without dimensions, late loading fonts, dynamically inserted content. Fix: explicit dimensions, font-display strategies, reserved space.
What Makes Performance Monitoring Sustainable
Three patterns separate sustainable performance monitoring from temporary efforts.
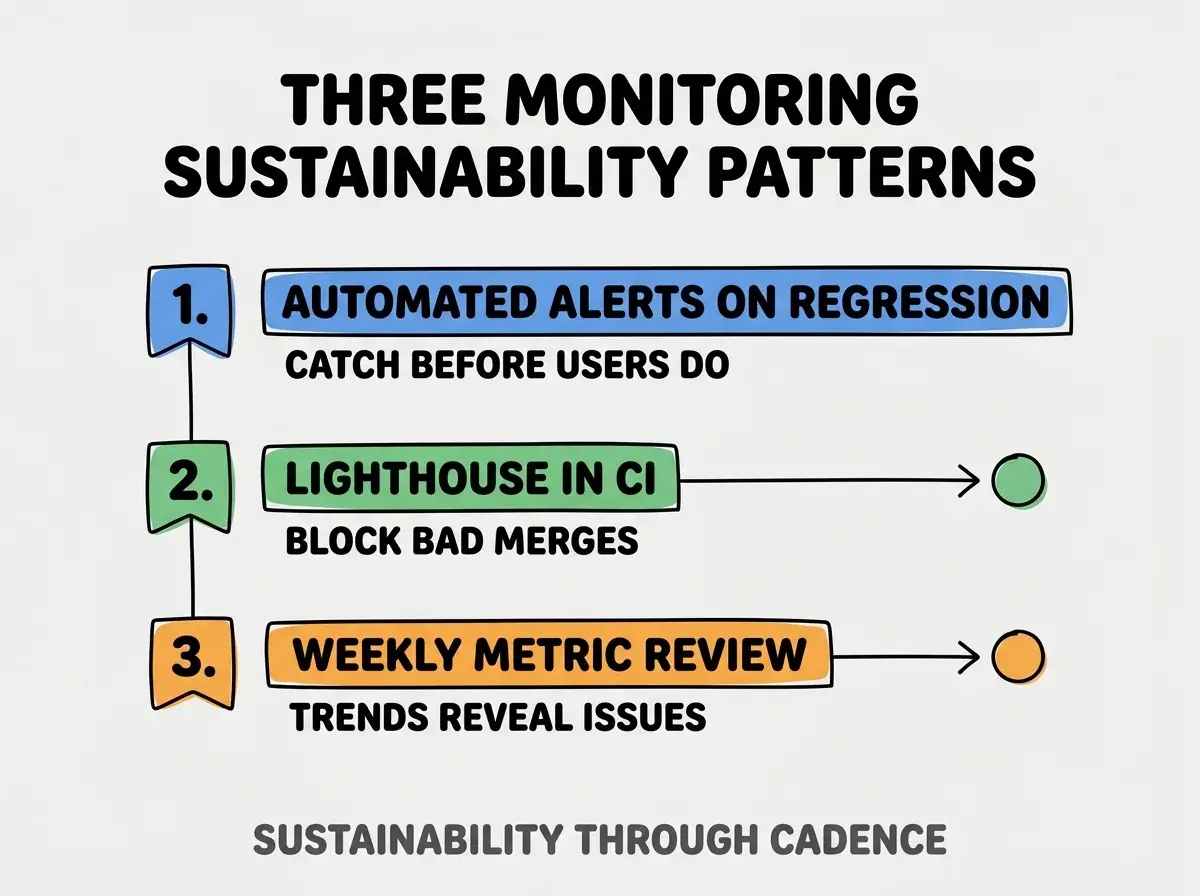
Pattern 1, automated alerts on regression. Slack or email alerts when metrics cross thresholds; reactive monitoring catches issues fast.
Pattern 2, Lighthouse in CI. PR checks include Lighthouse run; blocks merges that regress performance significantly.
Pattern 3, weekly metric review. Single weekly review of trends; catches gradual regressions that point in time alerts miss.
The combination produces monitoring that catches issues. Without these patterns, monitoring becomes occasional checks.
How To Set Up Real User Monitoring
Three setup patterns enable RUM for vibe coded apps.
Pattern A, Vercel Analytics for Vercel hosted apps. One line of code to enable; integrates seamlessly with Vercel dashboard.
Pattern B, Cloudflare Analytics for Cloudflare hosted. Free tier provides basic Core Web Vitals; paid tiers add details.
Pattern C, web-vitals library for self hosted. JavaScript library reports metrics to your analytics endpoint. Most flexibility, more setup.
Common Questions About Core Web Vitals
Core Web Vitals raise questions worth addressing directly.
The first question is whether Core Web Vitals affect ranking measurably. Yes; Google confirmed CWV as ranking factor in 2021; effect strengthened through 2025.
The second question is whether mobile or desktop scores matter more. Both; Google indexes mobile first; mobile score affects more queries.
The third question is whether to optimize for 75th percentile or median. 75th percentile; Google uses 75th percentile as ranking threshold.
The fourth question is how often Google updates ranking based on CWV. Continuous; metrics update in Search Console weekly; ranking adjusts continuously.
How Performance Affects Business Outcomes
Performance affects business outcomes in compounding ways. Outcome effects compound across user lifetime.
The first compounding effect is conversion rate impact. Faster pages convert better; conversion compounds across customers.
The second compounding effect is search ranking impact. Faster pages rank higher; ranking compounds traffic.
The third compounding effect is bounce rate impact. Faster pages bounce less; engagement compounds across pages.
The combination produces business impact that scales with traffic. Without performance, traffic growth produces proportional cost growth.
How To Improve Performance Systematically
Three patterns improve performance systematically.
Pattern A, focus on biggest impact first. Optimize LCP image first if LCP is bad; do not optimize TTFB if LCP is the problem. Impact prioritization.
Pattern B, measure before and after each change. Without measurement, optimization may regress in unmeasured area.
Pattern C, optimize for mobile networks. Throttle network in DevTools to 3G; mobile users experience this. Optimization for mobile usually helps desktop too.
The combination produces sustained performance improvement. Without prioritization, optimization scattered and ineffective.
The most damaging performance monitoring mistake is using Lighthouse scores as production performance measure. Lighthouse is lab data on developer's network; production is field data on user networks. The fix is to use Vercel Analytics or similar RUM as primary measure; Lighthouse for development testing only. Builders who use field data optimize what users actually experience; builders who use lab data optimize idealized conditions that do not match reality.
The other mistake is treating Core Web Vitals as one time fix. Performance regresses with new features; monitoring must be continuous.
A third mistake is ignoring TTFB. TTFB is foundation; bad TTFB makes other metrics impossible to fix.
A fourth mistake is missing the mobile context. Desktop optimization without mobile testing fails for majority of users.
What This Means For You
Performance monitoring Core Web Vitals in production produces sustained performance that compounds across years. The four metrics, monitoring tools, and improvement patterns produce apps that retain users and rank in search.
- If you're a senior dev: Add Vercel Analytics or similar today; setup is minutes, monitoring runs forever.
Browse more grow articles
Read more grow