To choose between Mixpanel, Amplitude, and PostHog for product analytics in 2026, evaluate against four factors that matter most for the decision (pricing fit for your scale, feature breadth versus depth, integration with your existing tools, team analytics maturity), then pick PostHog for indie/early-stage teams that need feature breadth at low cost, Mixpanel for mid-stage teams that prioritize ease-of-use and reporting polish, or Amplitude for larger teams that need enterprise-grade analytics and have budget for the investment. All three are good tools; the right answer depends on your specific stage and needs.
This piece walks through the four decision factors, the realistic pricing comparison, the feature differences that matter, and the four mistakes teams make when choosing analytics tools.
Why This Choice Matters More Than It Seems
Product analytics tool choice has multi-year consequences. Migrations between tools are painful (event re-instrumentation, dashboard recreation, historical data gaps). Choosing well the first time saves 6-18 months of disruption later.
The 2026 reality is that all three tools have matured significantly. The differences are no longer about which tool can do what; they are about which tool fits your team's specific needs, scale, and budget. The wrong choice costs more than the tool itself; the migration eventually consumes engineering quarters.
A 2025 G2 product analytics survey of 1,200 teams found that 38 percent had migrated between analytics tools at least once, and migration projects took 4-9 months on average to complete. The migration cost dwarfs the annual tool cost. Choosing the right tool for your stage prevents the migration; choosing wrong forces a multi-quarter project that delays product work. The choice deserves more thought than most teams give it.
The pattern to copy is the way restaurants choose POS systems. The wrong POS costs more in lost time and migration than the right POS costs in subscription fees. The same dynamic applies to product analytics; tool fit matters more than tool features in isolation.
The Four Decision Factors
Four factors consistently determine the right analytics tool for a given team. Weigh them based on your specific situation.
Factor 1, pricing fit for your scale. PostHog has the best free tier; Mixpanel and Amplitude have higher entry pricing but more sophisticated features. Match the pricing to your stage.
Factor 2, feature breadth vs depth. PostHog has many features (analytics, replays, flags, surveys) at moderate depth. Mixpanel and Amplitude focus on analytics with greater depth.
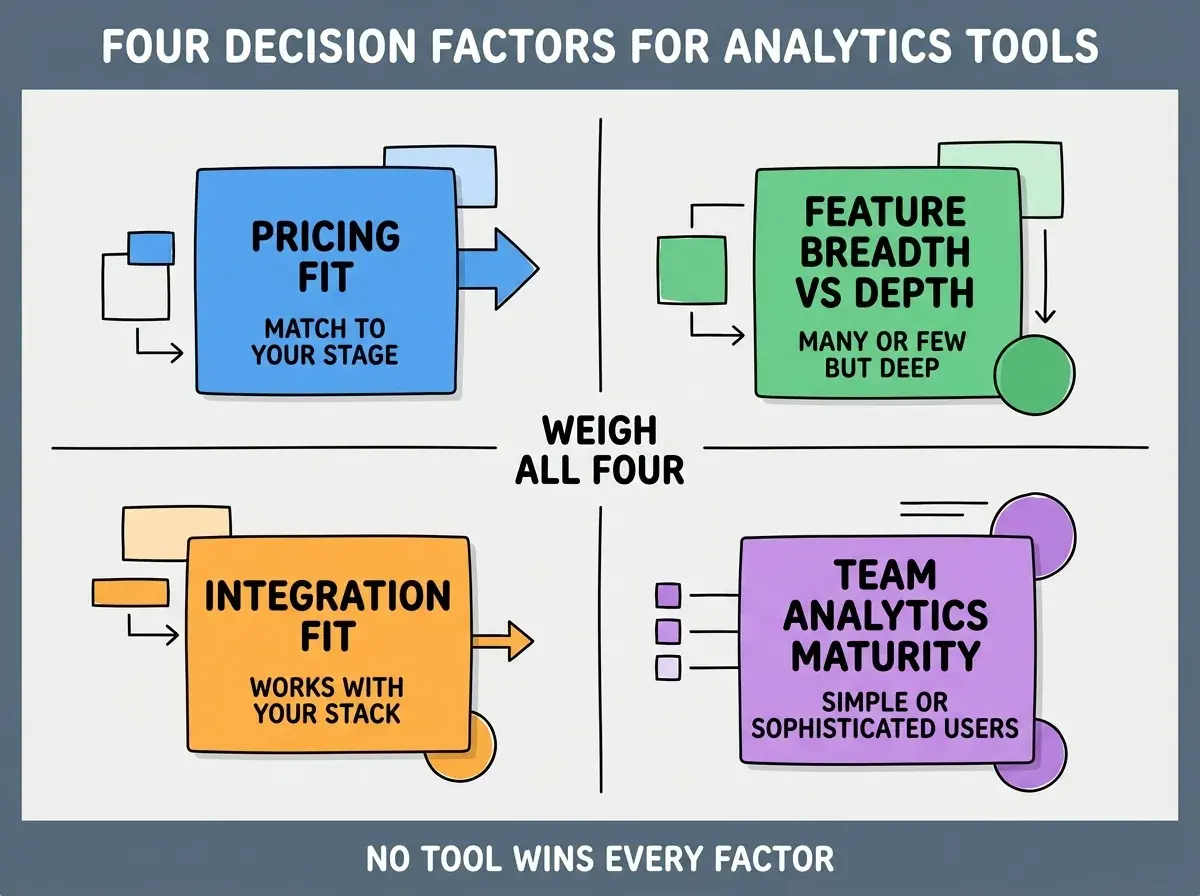
Factor 3, integration with your existing tools. Check support for your data warehouse, your engineering tools, your marketing stack. Bad integration multiplies operational cost.
Factor 4, team analytics maturity. Sophisticated teams use Amplitude's depth well; less-experienced teams find Mixpanel and PostHog more approachable.
The Realistic Pricing Comparison
Pricing comparisons are notoriously confusing because each tool prices differently. Three patterns help estimate realistic costs.
Pattern 1, PostHog free tier. 1 million events monthly free, then $0.0001 per event. For most apps under 100K monthly users, PostHog stays effectively free or under $100/month.
Browse more analytics tool guides
Read more grow articlesPattern 2, Mixpanel pricing. Free tier is more limited than PostHog (100K monthly events). Paid plans start around $25/month, scaling with usage. Mid-stage teams typically pay $200-500/month.
Pattern 3, Amplitude pricing. Limited free tier (10M events but limited features). Paid plans start around $50/month and scale aggressively. Enterprise pricing typically runs $1K-10K+/month.
The Feature Differences That Matter
Three feature categories show meaningful differences between the tools. Most other features are similar enough not to drive the decision.
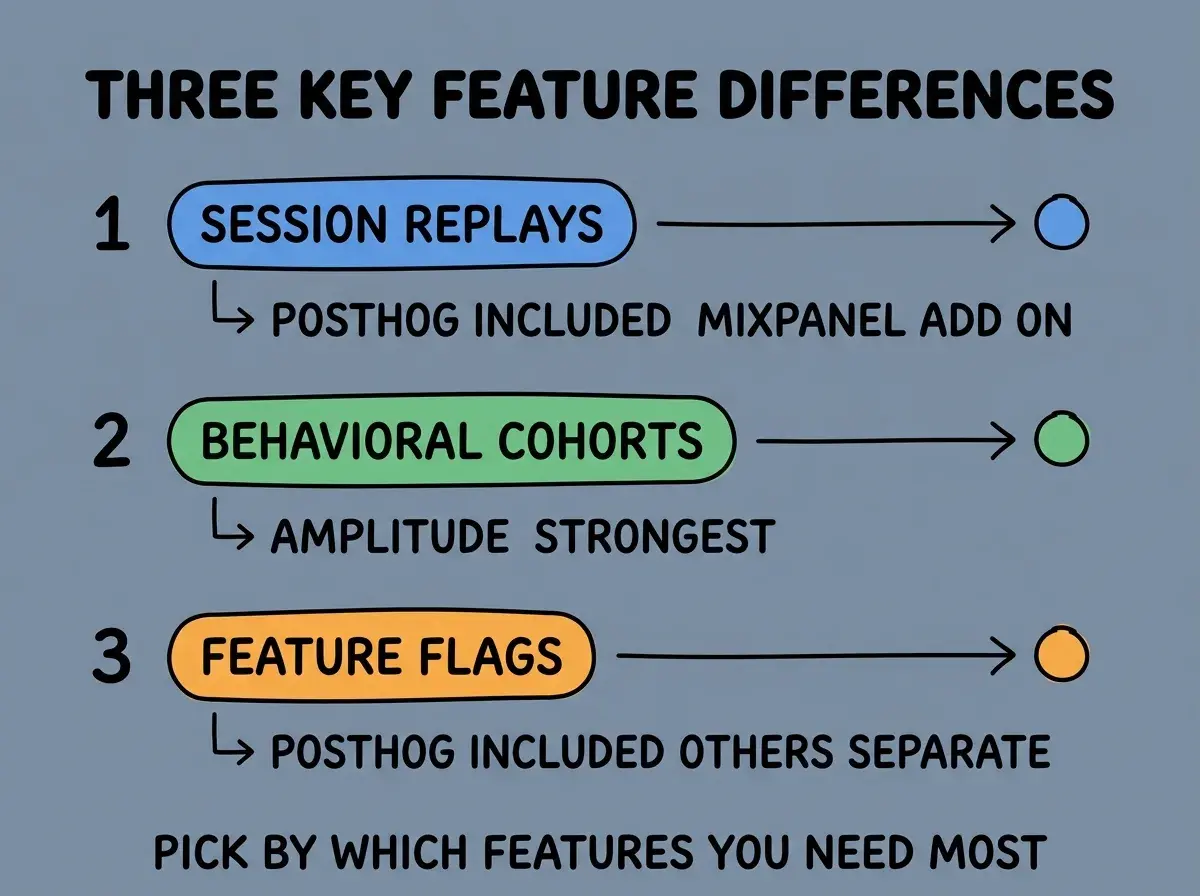
Difference 1, session replays. PostHog includes session replays in core product. Mixpanel offers them as add-on. Amplitude integrates with third-party tools. PostHog wins for builders who want both analytics and replays in one tool.
Difference 2, behavioral cohorts. Amplitude has the most sophisticated cohort analysis. Mixpanel is solid. PostHog is improving but historically less powerful here. Amplitude wins for teams with sophisticated cohort needs.
Difference 3, feature flags. PostHog includes feature flags. Mixpanel and Amplitude expect you to use separate tools (LaunchDarkly, Statsig). PostHog wins for builders who want fewer tools to manage.
The Recommended Choice by Stage
Three stage-based recommendations help most teams decide quickly.
Stage A, indie or pre-product-market-fit. PostHog. Free tier covers most needs; feature breadth supports rapid experimentation; one tool replaces three or four.
Stage B, post-PMF growth stage. Mixpanel. Polish, ease-of-use, and reporting quality justify the cost when product analytics drives meaningful business decisions.
Stage C, scale-stage or enterprise. Amplitude. Sophistication, depth, and enterprise features justify the higher cost when analytics maturity is high.
The combination gives most teams a clear answer. Edge cases exist (a small team using Amplitude because they came from Amplitude jobs; a scale team using PostHog because they value the open-source angle), but the stage-based heuristic works for most situations.
The most damaging analytics tool selection mistake is choosing based on feature checklists rather than realistic team fit. Founders read comparison articles, identify the tool with the most features, then discover their team does not use 80 percent of them while paying for the comprehensive plan. The fix is to evaluate based on the 5-10 features your team will actually use, not the full feature matrix. Teams that pick based on actual usage report 70 percent higher satisfaction with their analytics tool than teams that pick based on feature comprehensiveness. Fit beats features for analytics tool selection.
The other mistake is delaying the decision indefinitely. Some teams research analytics tools for months without picking one, accumulating no analytics data during the deliberation period. The fix is to pick PostHog as the default if you are stuck; the free tier means low risk, the feature breadth covers most needs, and migration to a more specialized tool later is cheaper than the cost of having no analytics now. Action beats analysis for analytics tool selection.
A third mistake is ignoring the data warehouse question entirely. Modern analytics increasingly involves exporting raw events to a data warehouse (Snowflake, BigQuery) for custom analysis. Tool choice matters less than data warehouse strategy for teams that will scale; the warehouse is the long-term source of truth, the analytics tools are interfaces to it. Plan for the warehouse early even if you do not implement it immediately.
How to Migrate Between Tools When You Outgrow One
Three patterns help when you need to migrate between analytics tools (typically PostHog to Mixpanel, or Mixpanel to Amplitude).
Pattern 1, run both tools in parallel for 30-60 days. Send events to both tools during the migration window. The overlap produces validation data and prevents history gaps when you cut over.
Pattern 2, recreate dashboards before cutting over. Configure the new tool's dashboards to match what you used in the old tool. The transition feels smoother when nothing breaks at cutover.
Pattern 3, archive (do not delete) the old tool data. Export historical data and store it. Deletion eliminates the option to look back; archiving preserves the option even after you stop paying.
The combination produces migrations that finish in weeks rather than months. Without these patterns, migrations stretch into multi-quarter projects that consume engineering capacity and produce data quality problems.
What This Means For You
The Mixpanel vs Amplitude vs PostHog choice matters but does not need to be agonizing. Pick based on your stage; revisit when stage changes.
- If you're a founder: Default to PostHog until you have specific reasons to prefer the alternatives. The starting cost is the lowest; the breadth is the highest.
- If you're changing careers into product: Learn whichever tool your target companies use. Job postings often specify; pick based on the market you want to enter.
- If you're a student: Practice with PostHog (free tier is generous) to learn product analytics fundamentals. The skills transfer to any tool.
Browse more growth tool comparisons
Read more grow articles