To set up PostHog for product analytics in 2026, install the PostHog SDK in your app, configure the four feature areas that matter most for builders (event tracking for behavioral data, funnels for conversion analysis, session recordings for qualitative insight, feature flags for safe rollouts), instrument the 5-10 events that map to user value, and use the dashboards as a weekly review tool rather than a vanity metric display. PostHog setup takes an afternoon for a basic implementation and produces the product analytics foundation that GA4 alone cannot provide.
This piece walks through the four feature areas, the events worth tracking, the dashboard patterns that drive decisions, and the four mistakes that turn PostHog into expensive shelfware.
Why PostHog Matters for Indie Builders
PostHog provides product analytics (funnels, retention, session replays, feature flags) that traditional analytics tools like Google Analytics handle poorly. For indie builders who need to understand product usage, not just marketing performance, PostHog has become the default tool because it combines breadth (many features in one product) with affordability (generous free tier).
The 2026 reality is that PostHog has matured into a complete product analytics platform that competes with Mixpanel and Amplitude at a fraction of the cost. The combination of self-hosting option, generous free tier, and feature breadth makes it the right starting point for most AI-built apps.
A 2025 IndieHackers analytics survey of 700 indie builders found that 64 percent who used PostHog reported that the analytics directly influenced product decisions, compared to 31 percent for GA4 users. The mechanism was straightforward: PostHog's funnel and retention reports map directly to product questions, while GA4's reports map to marketing questions. For product-focused teams, PostHog is the better tool; for marketing-focused teams, GA4 still wins.
The pattern to copy is the way restaurant managers use POS reports differently from marketing reports. POS reports tell you which dishes succeed and which fail (product analytics); marketing reports tell you which channels brought diners in. Both matter, but they answer different questions. PostHog is the POS report for software products.
The Four Feature Areas That Matter
PostHog has many features; four matter most for typical AI-built apps. Configuring these four covers most analytics needs.
Area 1, event tracking. Behavioral data about what users do in your product. Foundation for all subsequent analysis. Without good events, every other feature is limited.
Area 2, funnels. Conversion analysis between defined stages. Reveals where users drop off; informs where to focus optimization. The most-used feature for product teams.
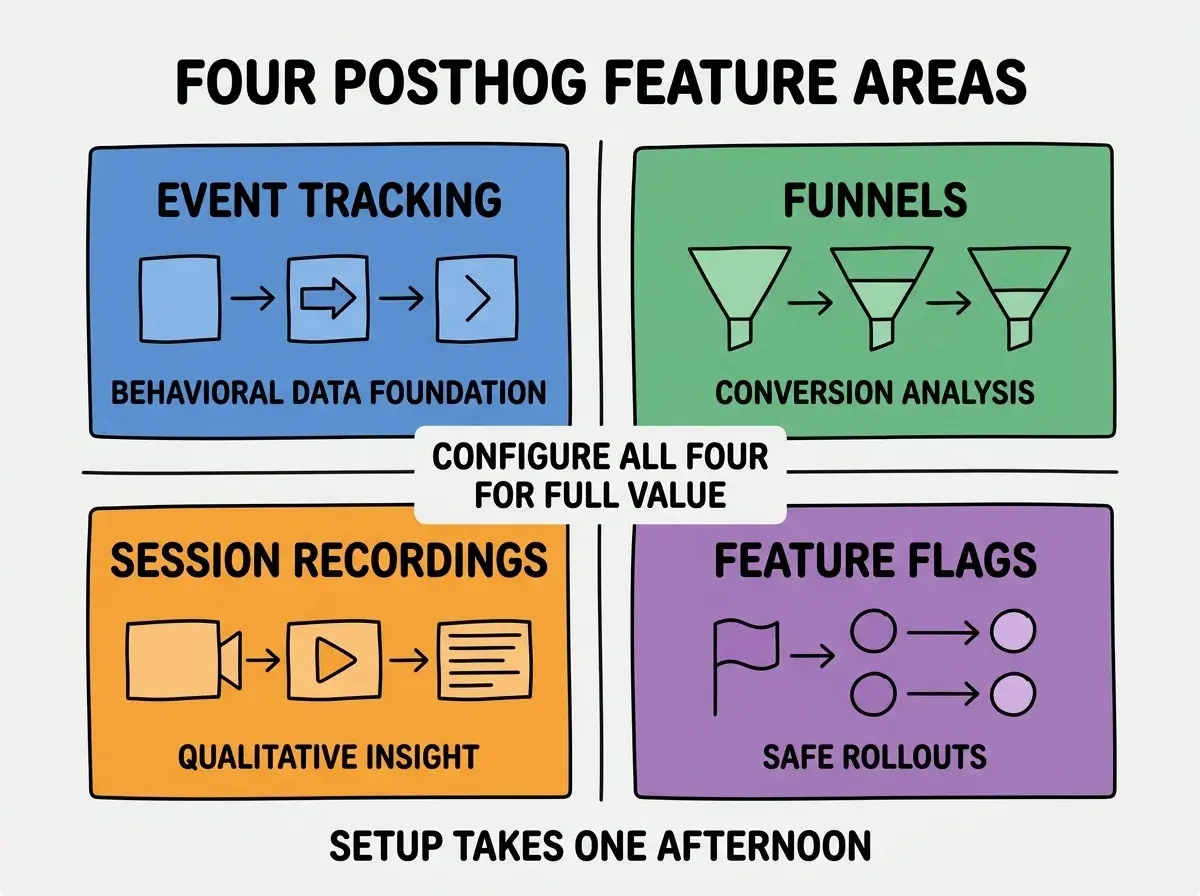
Area 3, session recordings. Visual playback of user sessions. Reveals what data alone cannot. Watching 10 sessions per week catches usability problems early.
Area 4, feature flags. Toggle features on/off per user or segment. Enables safe rollouts and A/B tests. The deployment safety net that lets you ship faster.
The 5-10 Events Worth Tracking
Three principles help pick which events to track when you cannot track everything.
Principle 1, track value moments. Events that represent user value (project created, message sent, integration connected). These predict retention better than traffic events.
Browse more analytics guides
Read more grow articlesPrinciple 2, track conversion gates. Events at funnel transitions (signup completed, trial started, paid). These map directly to revenue impact.
Principle 3, track friction points. Events at known difficulty points (form submission, integration setup, complex action completion). These reveal where users struggle.
The Dashboard Patterns That Drive Decisions
Three dashboard patterns turn PostHog data into product decisions rather than vanity metrics.
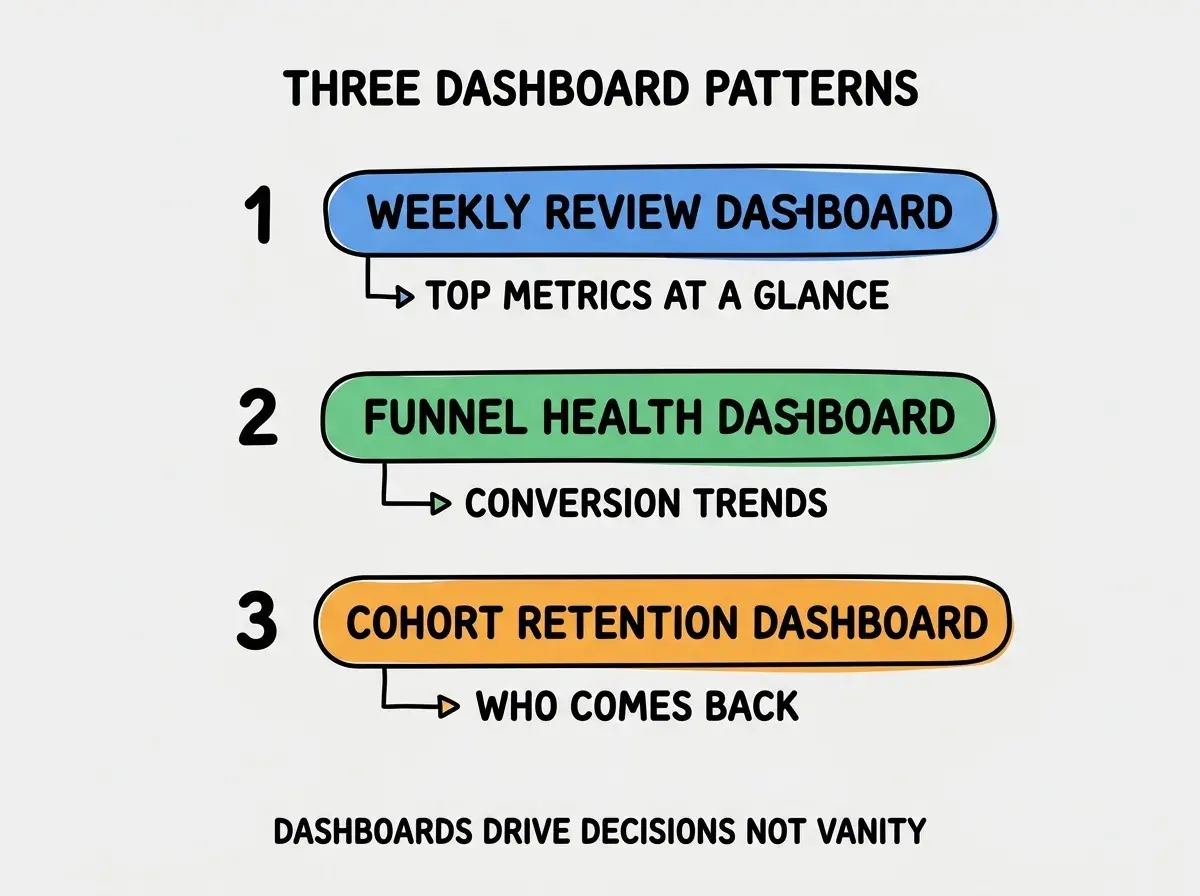
Pattern 1, weekly review dashboard. Top 5-10 metrics at a glance: signups, activations, key events, conversion rate. The dashboard you check every Monday morning.
Pattern 2, funnel health dashboard. Conversion trends through your main funnel over time. Reveals when conversion drops indicate something broke.
Pattern 3, cohort retention dashboard. Which user cohorts come back over weeks 1, 2, 4, 8. The retention curve predicts long-term product success better than any other metric.
How to Implement PostHog in an Afternoon
Three steps cover most PostHog implementations. The setup time is genuinely one afternoon for a basic configuration.
Step 1, install the SDK and verify autocapture. Add the PostHog snippet to your app, deploy, then check that pageviews appear in PostHog within minutes. Autocapture handles most basic events automatically.
Step 2, add 5-10 custom events at value moments. The events that map to user value (signup, activation, key feature usage). Each event takes 5 minutes to add; the full set takes an hour.
Step 3, configure your first funnel and dashboard. Define your main conversion funnel, build a basic dashboard with top metrics. The configuration takes 30 minutes and produces the analytics view you will use weekly.
The combination produces working product analytics by end of day. Without the systematic setup approach, PostHog implementation often spans weeks because teams add events ad-hoc rather than configuring the foundation first.
How to Use PostHog Without Drowning in Data
Three principles help avoid the analytics paralysis that comes from too much data.
Principle 1, set the weekly review cadence. 30 minutes every Monday. Review the dashboards, pick one thing to investigate further, take one action. The discipline matters more than the depth.
Principle 2, ignore most data most of the time. PostHog produces enormous volumes of data; trying to look at all of it produces no decisions. Focus on the 5-10 metrics that map to your top product priorities.
Principle 3, use session recordings sparingly but regularly. 10 recordings per week is enough; 100 is too many. Watch users where data shows problems; insights emerge from patterns across multiple sessions.
The combination produces analytics that drive decisions rather than analytics that consume time. Without these principles, PostHog becomes another tool that produces reports nobody acts on.
The most damaging PostHog setup mistake is tracking too many events from day one. Founders enable autocapture and add custom events for everything, then drown in noisy data nobody reviews. The fix is to start with 5-10 carefully chosen events that map to product value moments, then add events only when you have specific questions to answer. The 5-10 event teams report 3x higher decision rates from analytics than the everything-tracked teams. Selective tracking produces useful insight; comprehensive tracking produces unmanageable noise.
The other mistake is treating PostHog as a marketing analytics replacement for GA4. PostHog is excellent for product analytics; GA4 is better for marketing analytics (Google Ads integration, search queries, attribution). Use both: GA4 for marketing, PostHog for product. The combination covers what each tool does best without forcing one tool to do work it handles poorly.
A third mistake is enabling autocapture broadly without thinking about cost. PostHog's autocapture tracks every click and pageview; on high-traffic apps, this generates millions of events that exceed the free tier quickly. The fix is to enable autocapture selectively or rely on custom events only for high-volume apps. Cost-aware setup prevents the surprise bills that some teams hit after viral traffic spikes.
A fourth mistake is ignoring PostHog's experimentation features once they are configured. Many teams set up feature flags and A/B testing capabilities, then never run experiments. The fix is to schedule one experiment per month at minimum; the discipline of running experiments produces compounding learning over time. PostHog without experiments is a partial implementation.
What This Means For You
PostHog setup is high-leverage work for any AI-built app in 2026. The afternoon investment produces analytics that compound across every subsequent product decision.
- If you're a founder: Set up PostHog once you have meaningful product usage (typically 100+ active users). Below that, the analytics overhead exceeds the insight value.
- If you're changing careers into product or growth: PostHog fluency is increasingly expected for product roles. Practice with personal projects to build the skill.
- If you're a student: Set up PostHog on a portfolio project to learn. Even toy data teaches the dashboard patterns and feature configuration.
Browse more product analytics guides
Read more grow articles