A landing page A/B testing tool built with vibe coding takes a marketer from "I wonder which headline converts better" to "I have statistical evidence" in a weekend, without a developer or a SaaS subscription. The tool you will build by the end of this guide handles variant routing, conversion tracking, statistical significance calculation, and a small dashboard, all from a single Next.js app deployable to Vercel for free. The total code is roughly 400 lines, most of it generated by AI from clear prompts.
This piece walks through the architecture, the four data flows you need, the prompting sequence that produces working code, and the small statistical layer that distinguishes a real tool from a toy.
Why Marketers Should Build Their Own
Most marketers default to existing A/B testing tools (Optimizely, VWO, Google Optimize before it shut down). Those tools are powerful but expensive at scale, slow to integrate, and often privacy-unfriendly in ways that hurt page performance. For a small team running a handful of tests, a custom tool you built and own is faster, cheaper, and easier to debug.
The deeper reason to build your own is that the experience teaches you what is actually happening behind the scenes of A/B testing. Once you have shipped a tool and watched the data flow through, every conversation with a more sophisticated tool becomes legible. The understanding compounds across every future testing decision.
A 2025 ConvertKit survey of 600 marketing teams found that 47% had abandoned A/B testing entirely because their existing tools were too slow, too expensive, or too complicated to set up. Custom tools built with AI assistance have closed that gap, with the median build time dropping from "multiple weeks of engineering" to "one focused weekend."
The pattern to copy is the way email marketers eventually built their own analytics dashboards rather than paying for enterprise tools. Once the components were available (basic web apps, simple databases, charting libraries), the build became cheaper than the subscription. A/B testing has reached the same point.
The Four Data Flows
Almost every A/B testing tool, including yours, follows the same four data flows. Knowing them is most of the architecture work.
Flow 1, variant assignment. When a visitor lands on your page, the tool decides which variant to show (control or treatment). The decision must be deterministic per visitor (so they see the same variant on every page reload) and roughly even across the population. The standard approach is to hash the visitor's cookie ID and use the result to pick a variant.
Flow 2, exposure logging. Every time a visitor sees a variant, the tool logs that they were exposed. Without this log, you cannot calculate conversion rates because you do not know how many people saw each version.
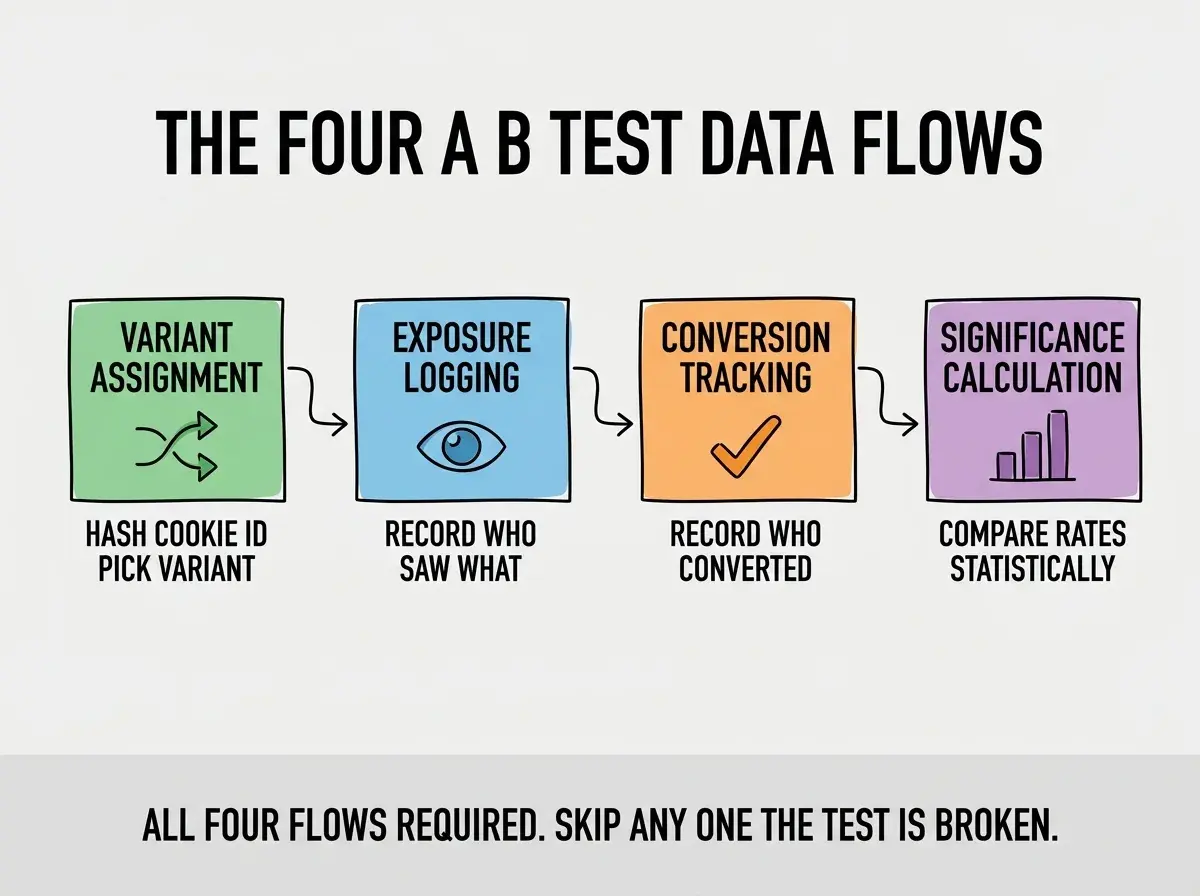
Flow 3, conversion tracking. When the visitor completes the action you care about (signup, purchase, click), the tool logs the conversion event tied to the same visitor and variant. This is where most homemade tools fall apart, because the conversion event is often on a different page or even a different domain than the assignment.
Flow 4, significance calculation. Once you have exposures and conversions, you compute the conversion rate per variant and a statistical test (chi-squared or Bayesian) to decide whether the difference is real or noise. Without this, you cannot tell a meaningful winner from a coincidence.
The Prompt Sequence That Builds It
The most efficient way to build the tool is a sequence of focused prompts to your AI tool of choice, each one producing a working slice. The exact prompts matter less than the order, which I will walk through below.
Prompt 1, the data model. Ask for a Postgres or SQLite schema with three tables, experiments (id, name, variants), exposures (visitor_id, experiment_id, variant, timestamp), and conversions (visitor_id, experiment_id, variant, value, timestamp). The AI will produce the migration file.
Prompt 2, the variant assignment middleware. Ask for a Next.js middleware that, on every request, assigns a variant based on a cookie hash and sets a response header indicating which variant was shown. The AI will produce the middleware code.
Read more marketer-friendly tutorials for vibe coding
Browse build articlesPrompt 3, the tracking endpoints. Ask for two API routes, one that logs exposure (called from the page on render) and one that logs conversion (called from the page on the conversion event). The AI will produce both endpoints.
Prompt 4, the dashboard. Ask for a simple admin dashboard that lists running experiments, shows conversion rates per variant, and computes statistical significance. The AI will produce the dashboard with charts.
The Statistical Layer
The single most important part of an A/B testing tool is the statistical test that decides whether one variant is genuinely better than another. The naive approach (just pick whichever variant has a higher conversion rate) is wrong, because random noise produces fake winners constantly.
The minimum acceptable test is a chi-squared test of two proportions, comparing the conversion counts and exposure counts of the two variants. If the resulting p-value is below 0.05, the difference is statistically significant. Most spreadsheet apps and JavaScript libraries can compute this in three lines.
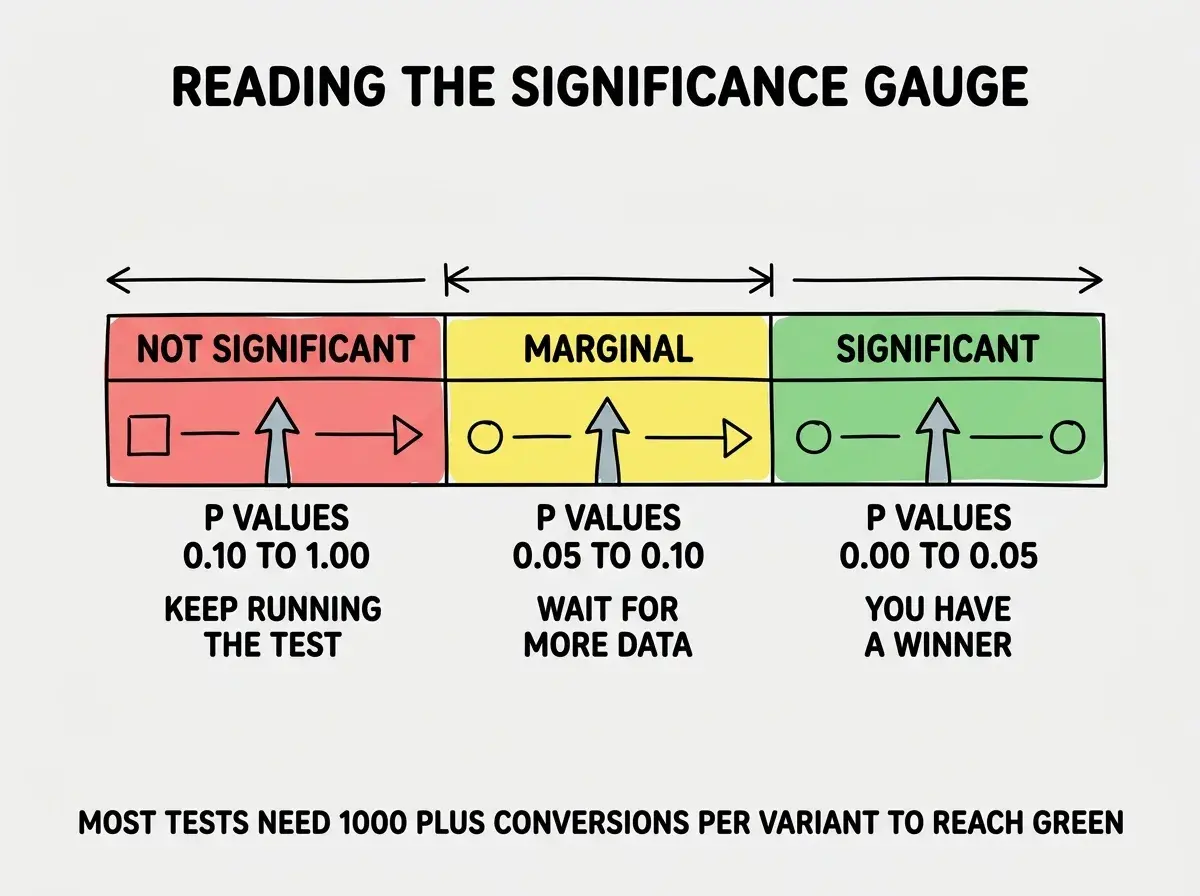
The advanced upgrade is a Bayesian test, which produces probabilities ("variant B has a 92% chance of being better") that are more intuitive than p-values. The math is more complex but most AI tools can implement it correctly when prompted with the right reference. Both approaches are valid, the Bayesian framing usually helps non-technical stakeholders interpret results.
The most expensive A/B testing mistake in vibe coded tools is stopping the test early. The "winner" at day three with 200 conversions per variant is often not the winner at day twenty with 2000 per variant. Set a minimum sample size before starting and resist the temptation to call it early when one variant looks ahead. Statistical noise is louder than most people expect.
The corollary is that low-traffic sites should run fewer, longer tests rather than many short ones. A site with 500 visitors per day cannot realistically detect a 10% conversion lift in a week, the math just does not allow it. Plan tests around the traffic you have.
The other piece worth knowing is that you should test one thing at a time, not bundle multiple changes into one variant. If your treatment variant has a new headline AND a new image AND a new button color, you have no way to know which change drove the result. Isolation is what makes the experiment scientifically meaningful, not just statistically significant. Many marketing teams test bundles because they want results faster, then end up with a winner they cannot explain or replicate.
What This Means For You
Building your own A/B testing tool is one of the highest-leverage weekend projects a marketer can take on. The tool itself is useful, the understanding it produces is more useful, and the cost is one weekend of focused work.
- If you're a founder: Spend the weekend before your next launch building this. The tool pays for itself the first time you ship a winning variant of your hero copy.
- If you're changing careers: A working A/B testing tool in your portfolio signals that you can ship real software with measurable business value. Hiring managers respond to it.
- If you're a student: Reproducing this tool teaches statistics, web development, and product thinking simultaneously. The lesson density is unusually high.
Browse more marketer-friendly build tutorials
Read more build guides