Log aggregation is the practice of shipping logs from every part of your app, web servers, background workers, scheduled jobs, third-party integrations, into one searchable database. For a solo builder, the difference between scattered logs and aggregated logs is the difference between debugging in hours and debugging in minutes. Every place your app emits log lines should ship them to the same destination, and that destination should be queryable on any field, not just by time.
This guide covers the tools that make log aggregation cheap and easy for solo builders, the shipping pattern that works across every framework, and the dashboards that turn raw logs into operational insight.
Why Scattered Logs Kill Solo Builders
Most vibe coded apps emit logs in three to five places. The web server logs to its hosting platform. The background worker logs to its queue service. The cron job logs to wherever the cron runs. The third-party integration writes its own logs. Production logs to a different place than staging. The result is that when something goes wrong, you have five tabs open and are correlating timestamps by hand.
This is sustainable for exactly one person debugging exactly one issue at a time. Add any complexity, multiple users hitting different bugs, an issue that crosses service boundaries, a problem that started yesterday, and the scattered approach collapses. The fix is to ship every log line to one place and search across all of them.
A 2024 industry survey of small SaaS operators found that solo builders who centralized their logs spent a median of 11 minutes per incident on log investigation, compared to 47 minutes for builders with scattered logs. The 4x improvement was the largest single productivity gain reported.
The pattern to copy is a hospital intake desk. No matter what part of the hospital a patient came from, the intake desk has the complete record. Every test result, every prescription, every prior visit, all in one place searchable by name, date, or condition. Your logs need the same posture.
Picking a Log Service
The three services I recommend for solo builders, in rough order of best fit, are Better Stack, Axiom, and Datadog. Each has a generous free tier, accepts logs over HTTP, and provides search and dashboards out of the box.
Better Stack (formerly Logtail) is the simplest setup, with a free tier that covers up to 1 GB of logs per month. It bundles uptime monitoring, status pages, and incident management on the same subscription, which is convenient if you are also setting up those tools. The query language is similar to SQL, easy to pick up.
Axiom has a uniquely generous pricing model for solo builders, the free tier includes 500 GB of monthly ingest with 30-day retention, which is enough for almost any pre-revenue app. The query language (APL) is more powerful but takes a day to learn. The performance on large queries is better than Better Stack.
Datadog is the enterprise choice. The free tier is limited but the paid tiers offer the most powerful querying, the most integrations, and the best alerting. The cost climbs quickly past 100 GB per month, so it is overkill for most solo builders.
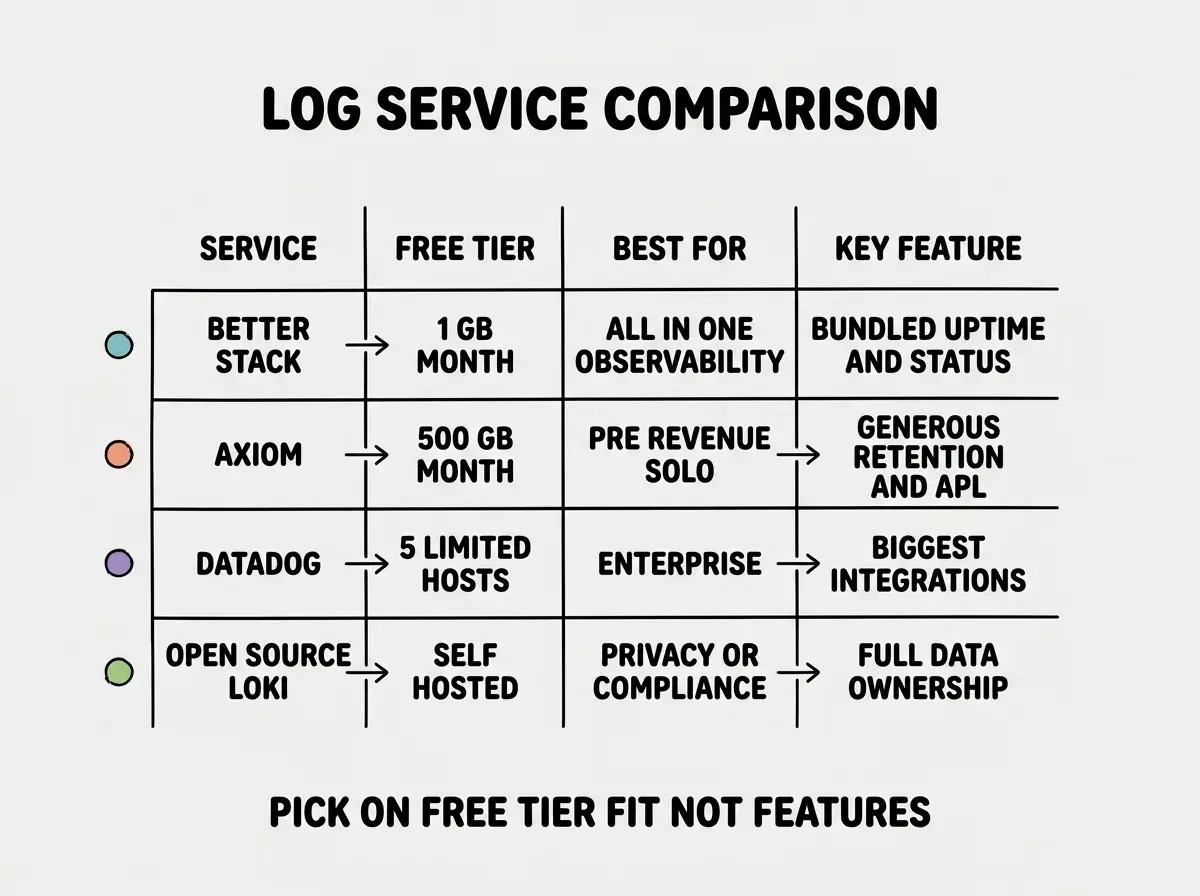
The other option worth mentioning is self-hosted Loki, which is what major Kubernetes shops run. For a solo builder, the operational cost of running Loki is usually higher than just paying for a hosted service. Skip it unless you have specific privacy or compliance needs.
The Shipping Pattern
The integration with any of these services is similar. Install a small library, configure it with an API key from the service, and pipe your existing logger output through it. The pattern works for any framework.
import pino from 'pino';
import { betterStackTransport } from './better-stack';

const logger = pino({
  level: process.env.LOG_LEVEL ?? 'info',
  transport: {
    targets: [
      { target: 'pino/file', options: { destination: 1 } },
      { target: betterStackTransport, options: { token: process.env.BETTER_STACK_TOKEN } },
    ],
  },
});
The pattern above logs to both stdout (for local development and platform-native log viewing) and to Better Stack (for centralized search). This dual output means you do not lose anything if the log service has an outage, and you do not need to switch tools when debugging locally.
Read the rest of the operations series for solo builders
Browse the grow categoryThe shipping itself is buffered and asynchronous. Your application code does not wait for logs to leave the machine, the transport library batches lines and sends them every second or every 100 lines, whichever comes first. This means logging never blocks request handling, even if the log service is briefly slow.
Configuring Useful Dashboards
Raw centralized logs are a database. The value comes from the queries you run against them. The minimum viable dashboard set is small but high-leverage.
Error rate over time. Count log entries with level: error per minute. Spikes are visible immediately, and the underlying entries are one click away. This single dashboard catches roughly 60% of the production issues a small app sees.
Latency by endpoint. If your logs include request duration, group by URL path and show p95/p99 latency over time. This catches slow endpoints before they become user complaints.
Top errors by request count. Group all error log entries by the error message or error code and rank them by count. The top three usually account for 80% of error volume, and fixing those three is high leverage.
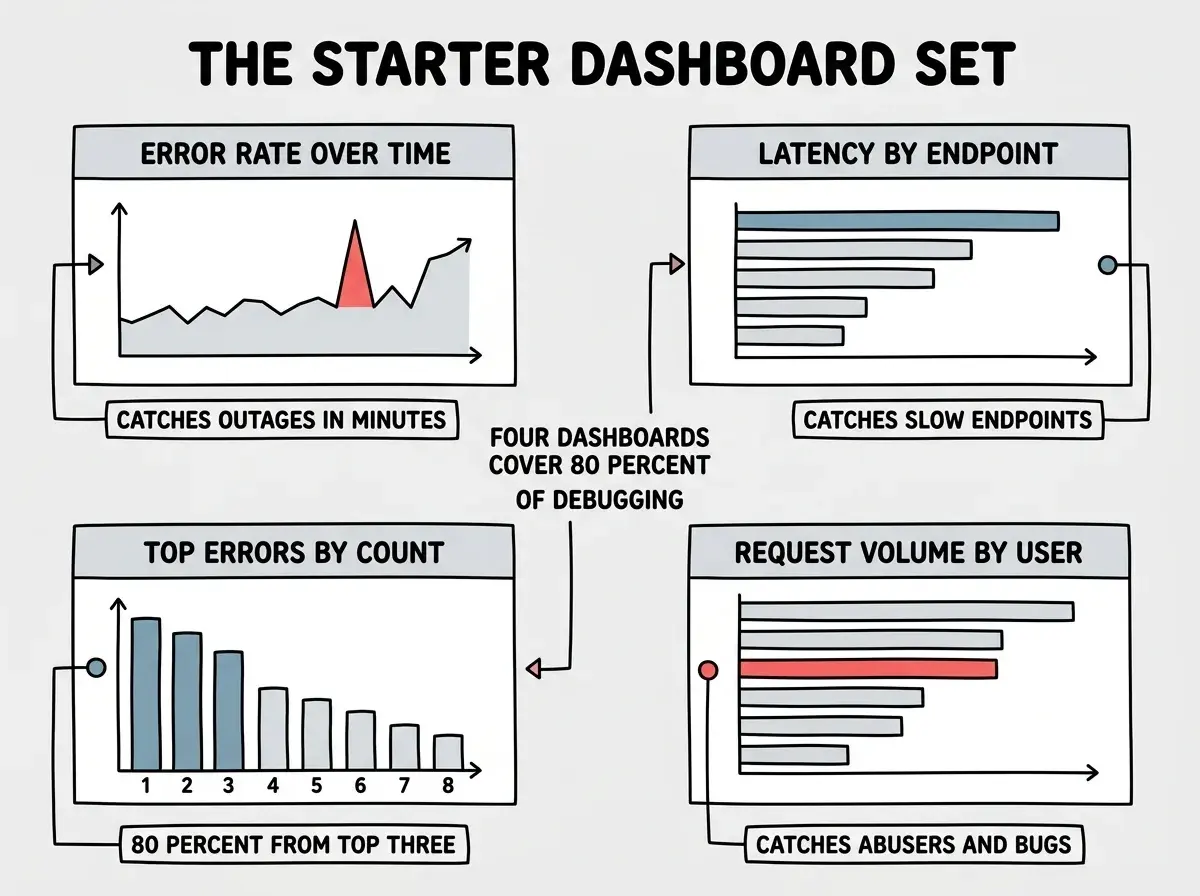
Request volume by user or IP. Most log services support this kind of grouping natively. The pattern is to find users or IPs generating an unusual amount of traffic, often abuse or buggy clients hammering an endpoint. Catching this early prevents bills and outages.
The most expensive log aggregation mistake is shipping logs without sampling or filtering, then watching the bill explode when traffic grows. Configure sampling on debug-level logs (keep 1 in 100), filter out health check pings, and set retention to 30 days as a default. Most builders only need long retention for specific compliance requirements.
The compounding return on log aggregation is enormous. Every dashboard you build, every saved query you write, every alert you configure stacks. After three months, you have a body of operational knowledge that turns most "what happened" investigations into a 60 second query.
What This Means For You
Log aggregation is one of the highest-leverage operational investments a solo builder can make. The setup, install a transport, point it at one of the three services, configure four dashboards, takes one afternoon and pays back during your first real incident.
- If you're a founder: Do this before your first paid customer. The first time something breaks at 11pm, you will not have time to set it up, and the cost of debugging without it is exactly when you can least afford it.
- If you're changing careers: Configuring centralized logs and useful dashboards is the kind of operational fluency that distinguishes "engineer" from "engineer who can be trusted with production." Practice once on a personal project.
- If you're a student: Sign up for any of the three free tiers and ship the logs from a class project to it. Build the four dashboards. The exercise teaches more than a textbook chapter.
Browse more observability and operations guides
Read more grow guides