To understand geographic AI coding adoption patterns in 2026 and why APAC leads, recognize the four regional adoption patterns the data reveals (APAC leads with 84 percent developer adoption driven by competitive markets and tech industry concentration, North America follows at 76 percent with strong enterprise adoption alongside individual use, Europe at 68 percent with regulatory caution constraining enterprise adoption, and other regions at 45-60 percent with varying patterns by country), see what the patterns reveal about market direction, and consider what the regional patterns mean for builders thinking about geographic strategy. The regional patterns reveal both where opportunities exist and how strategy should adapt by region.
This piece walks through the four regional patterns, what drives APAC leadership, the implications for builders, and the four mistakes when interpreting geographic adoption data.
Why Geographic Adoption Patterns Matter
Geographic adoption patterns matter for builders thinking about market entry and product positioning. The patterns matter; serving APAC markets requires different positioning than serving Europe, and matching strategy to regional adoption patterns produces better outcomes than generic global positioning.
The 2026 reality is that adoption varies dramatically by region. Aggregate global adoption statistics hide this variance; regional adoption patterns produce more accurate market understanding than global averages.
A 2025 cross regional developer survey of 30 countries found adoption rates ranging from 87 percent in Singapore to 32 percent in some emerging markets. The 55 percentage point spread reveals dramatic regional variance; aggregate global statistics hide this variance.
The pattern to copy is the way mobile adoption played out regionally through the 2010s. APAC led mobile adoption; Western markets followed; emerging markets adopted last but often leapfrogged Western adoption patterns. AI coding adoption follows similar regional patterns; understanding the variance produces better market strategy than treating all regions identically.
The Four Regional Patterns
Four regional patterns characterize global AI coding adoption.
Pattern 1, APAC leads at 84 percent developer adoption. Singapore, South Korea, Japan, India all show high adoption. Competitive markets and tech industry concentration drive adoption.
Pattern 2, North America at 76 percent with strong enterprise plus individual. US adoption combines high individual use with substantial enterprise deployment. Both drive total adoption.
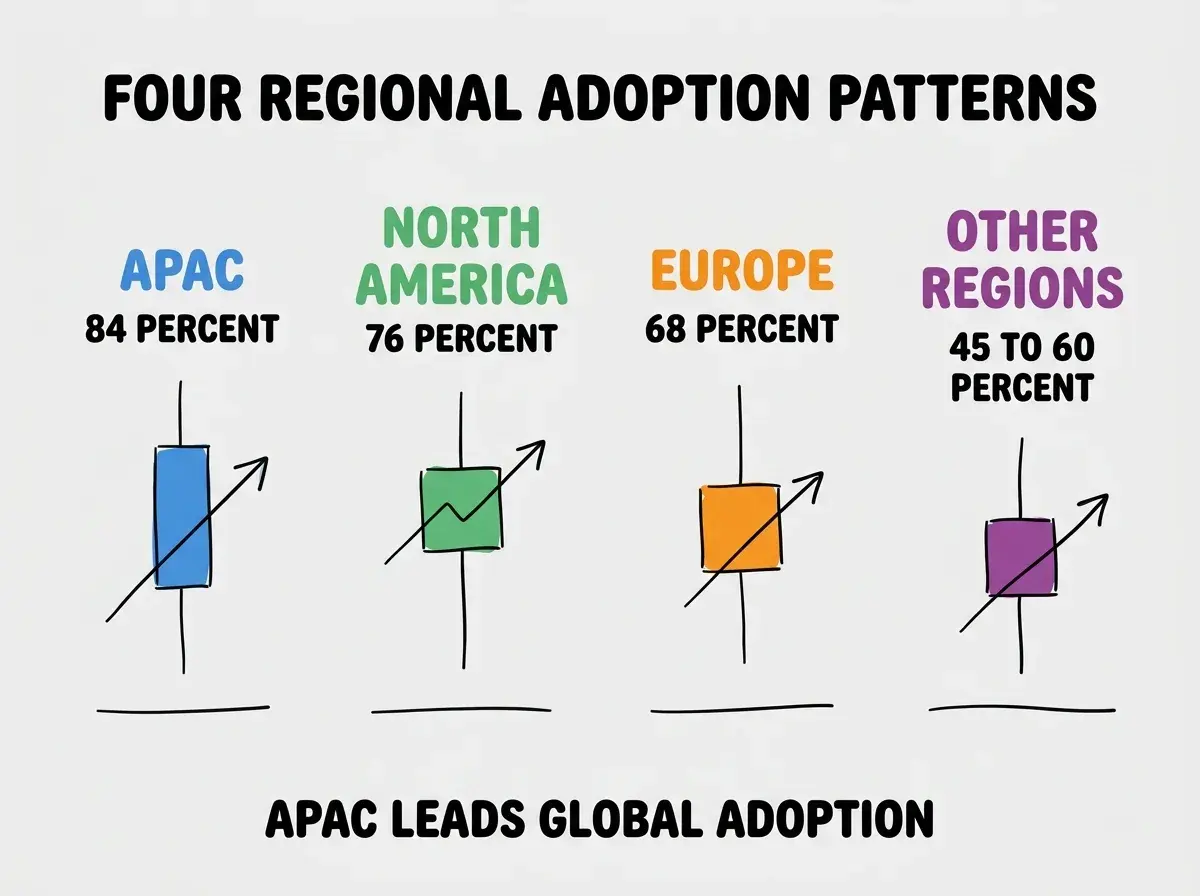
Pattern 3, Europe at 68 percent with regulatory caution. Strong individual adoption but enterprise adoption constrained by GDPR concerns and AI Act compliance work. Regulatory environment slows enterprise adoption.
Pattern 4, other regions at 45-60 percent with country variance. Latin America, Africa, Middle East, Eastern Europe show varying adoption. Country specific factors dominate.
Why APAC Leads
Three patterns explain APAC adoption leadership.
Pattern 1, competitive job markets reward AI fluency strongly. APAC tech job markets are highly competitive; AI fluency provides differentiation that drives adoption. Career incentives accelerate adoption.
Browse more market analysis
Read more pulse articlesPattern 2, tech industry concentration produces network effects. Singapore, South Korea, and India have concentrated tech industries where peer adoption drives individual adoption. Concentration accelerates network effects.
Pattern 3, lighter regulatory environment than Europe. APAC regulatory environments allow faster enterprise AI adoption than European environments. Regulatory speed enables business adoption speed.
What Geographic Patterns Mean For Builders
Three implication patterns matter for builders thinking about geographic strategy.
Implication 1, APAC markets reward speed over deliberation. Fast moving markets favor first movers. Builders entering APAC should optimize for speed.
Implication 2, European markets require compliance from start. GDPR, AI Act, sector specific regulations matter dramatically for European market entry.
Implication 3, North America rewards enterprise sales sophistication. Enterprise market dominates US revenue; builders need enterprise capabilities to capture US opportunity.
How Builders Should Position by Region
Three positioning patterns help builders match strategy to region.
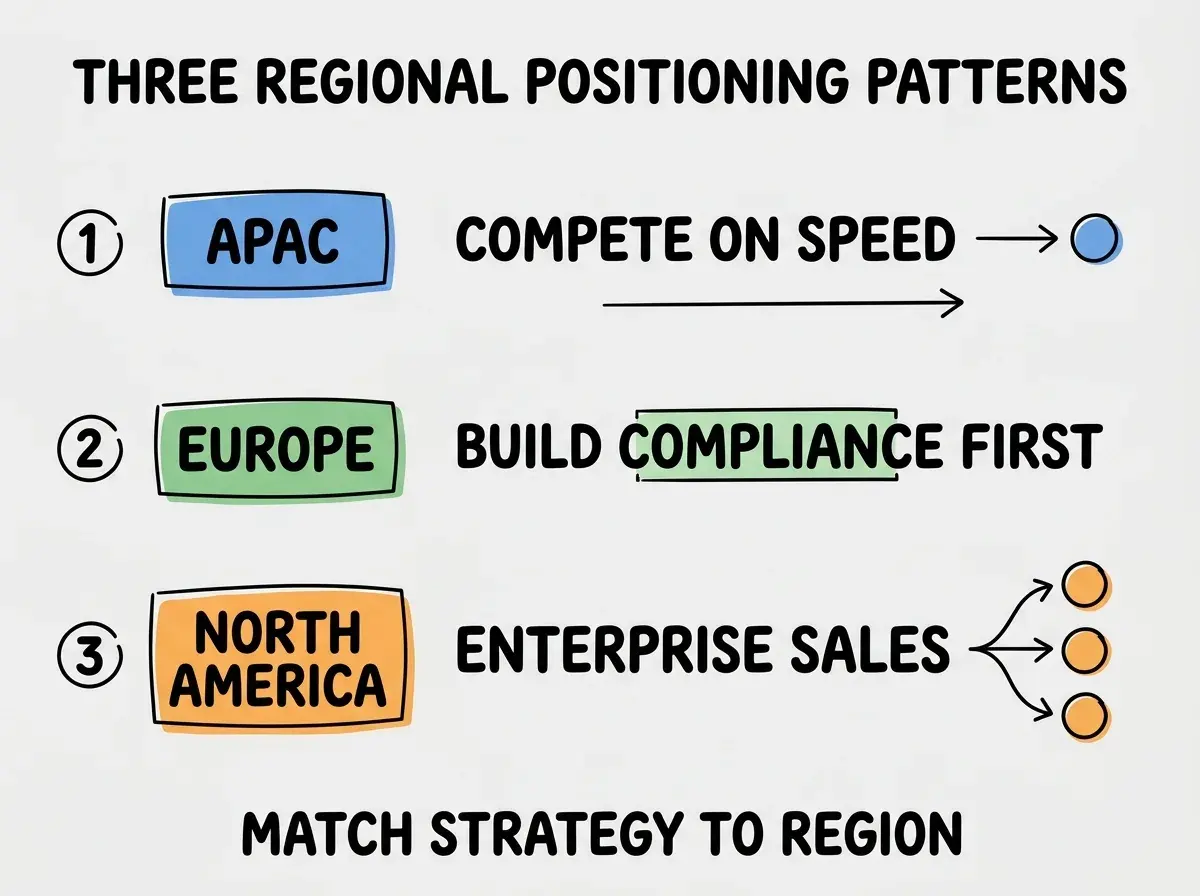
Pattern 1, APAC requires speed to market and competitive positioning. First mover advantages compound in fast moving APAC markets.
Pattern 2, Europe requires compliance from start. Compliance retrofit is harder than baseline compliance for European market entry.
Pattern 3, North America requires enterprise sales capabilities. Enterprise sales differ dramatically from SMB or consumer sales motions.
The combination produces geographic strategy that respects regional patterns. Without these patterns, builders treat global markets identically and underperform in all regions.
The most damaging geographic interpretation mistake is treating global markets as homogeneous. Aggregate global statistics hide dramatic regional variance; using global averages for specific market planning produces wrong strategy. The fix is to plan by region with region specific patterns; APAC strategy should differ from European strategy should differ from North American strategy. Regional differentiation produces better outcomes than generic global approach in every region.
The other mistake is assuming APAC leadership transfers automatically. APAC patterns reflect specific market conditions; copying APAC tactics in other regions often produces wrong strategy. The fix is to understand drivers behind regional patterns rather than just copying tactics.
A third mistake is missing the language and cultural dimensions. AI tools work better in some languages than others; cultural acceptance varies by region. The fix is to consider language and culture alongside adoption rates.
A fourth mistake is treating regions as monolithic. Within APAC, Japan differs from India differs from Singapore. The fix is to consider country specific patterns within regions.
How Geographic Patterns Will Likely Evolve Over Time
Three evolution predictions matter for thinking about regional trajectory over the next 3-5 years. First, European adoption will likely accelerate as AI Act implementation provides clarity that current uncertainty prevents; clarity often accelerates adoption that uncertainty constrains. Second, emerging markets may leapfrog Western adoption patterns by adopting AI tools without prior tooling baggage; similar pattern played out with mobile payments in Africa. Third, geographic concentration of AI capabilities may create new regional hubs; cities and regions that establish AI fluent talent pools may attract disproportionate investment.
The geographic shifts matter for builders thinking about long term market positioning. Plans that account for likely regional shifts produce different decisions than plans assuming current patterns persist permanently.
Engineering leaders should also recognize that regional patterns affect remote team composition. Teams hiring globally face different talent pools by region; understanding which regions produce AI fluent talent versus which produce traditional engineering talent informs hiring strategy. Regional talent specialization is real and matters for team building decisions.
The implications for vendor selection also matter; vendors with regional strength may serve specific regional markets better than global vendors with shallow regional presence. Builders selecting tools for international teams should consider regional vendor strength alongside generic feature comparisons.
Geographic strategy also affects pricing decisions. Different regions have different willingness to pay; uniform global pricing often misses revenue opportunities in higher willing regions or excludes lower willing regions. Regional pricing produces better revenue capture across diverse global markets.
Compliance variance affects product strategy beyond just sales motion. European GDPR and AI Act compliance requires data residency, audit trails, and explainability features that other regions may not require. Building these features for European market produces benefits that may transfer to other regions as regulations spread globally.
What This Means For You
The geographic adoption patterns reveal both opportunity and timing for builders thinking about regional strategy. The four patterns, positioning approaches, and APAC drivers produce framework for region specific decisions.
- If you're a founder: Geographic strategy matters dramatically. Match positioning to region; mismatched positioning produces poor outcomes regardless of execution quality.
- If you're a senior dev: Geographic patterns affect career opportunities. Regions with high adoption produce more opportunities; willingness to relocate or work remotely opens regional opportunities.
- If you're a student: Geographic patterns affect entry opportunities. APAC markets hire AI fluent juniors most aggressively; other markets may require additional credentials for entry.
Browse more market analysis
Read more pulse articles