E-commerce analytics dashboards covering conversion funnels, AOV, and LTV give store operators visibility into growth levers. Four metric categories matter: conversion funnels (visitor to purchase steps with drop off), average order value (revenue per order trends), lifetime value (customer revenue across purchases), and cohort retention (purchase frequency by cohort). Combined dashboards reveal where to invest; without analytics, growth decisions guess.
This tutorial walks through the four categories, the implementation patterns, what makes analytics sustainable, and the four mistakes builders make on e-commerce analytics.
Why E-commerce Analytics Matter
E-commerce analytics matter because growth decisions need data. Where to invest marketing, what products to promote, when to optimize checkout all depend on funnel and cohort understanding.
The 2026 reality is that AI tools (Claude, GPT) can build analytics dashboards in days that previously required dedicated analytics engineering teams.
A 2025 e-commerce study of 400 stores found that stores with comprehensive analytics dashboards grew revenue 28 percent faster than stores relying on platform default analytics, primarily through better optimization of conversion funnel weak points. Analytics measurably affect growth velocity.
The pattern to copy is the way restaurant operators track table turnover, average ticket, and customer return rate to optimize operations. Three metrics inform daily and strategic decisions. Same patterns apply to e-commerce; funnels, AOV, LTV, cohorts inform what to optimize.
The Four Metric Categories
Four categories form complete e-commerce analytics.
Category 1, conversion funnels. Visitor to purchase steps. Foundation.
Category 2, average order value. Revenue per order. Pricing health.
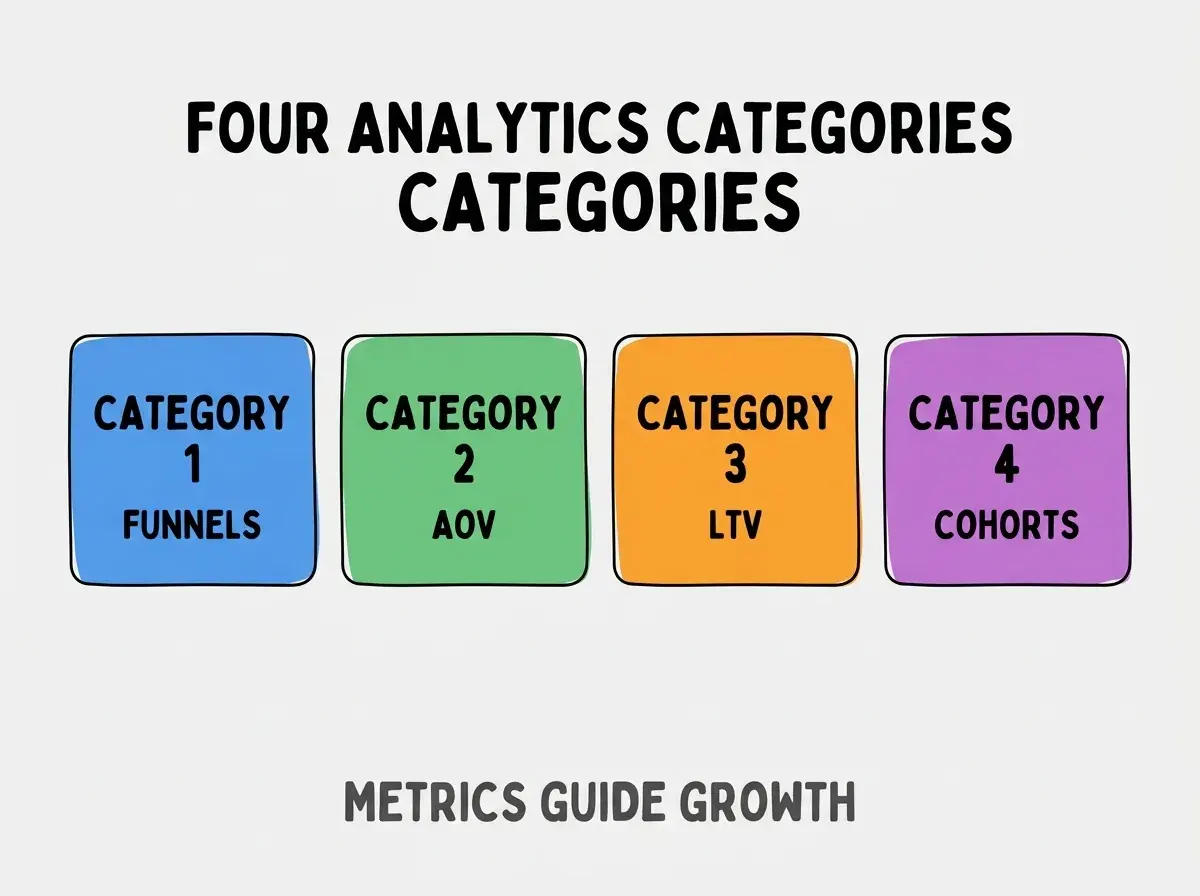
Category 3, lifetime value. Customer revenue across purchases. Retention health.
Category 4, cohort retention. Purchase frequency by cohort. Time series.
How To Implement Each Category
Four implementation patterns address each category.
Implementation 1, funnel from event tracking. Page views, add to cart, checkout, purchase events; calculate drop off.
Browse more build
Read more buildImplementation 2, AOV from order data. Sum order revenue divided by orders; segment by channel, time, product.
Implementation 3, LTV from customer history. Sum lifetime revenue per customer; project from cohort patterns.
Implementation 4, cohort retention from purchase dates. Group customers by first purchase month; track repeat rates.
What Makes E-commerce Analytics Sustainable
Three patterns separate sustainable from one off scripts.
Pattern 1, automated data pipeline. Manual analytics fail; automation maintains.
Pattern 2, dashboard accessible to non technical. Operators see metrics directly; not engineering tickets.
Pattern 3, alerts on anomalies. Notify when metrics shift; not require monitoring.
What Makes Analytics Strategy Effective
Three patterns separate effective from theatrical.
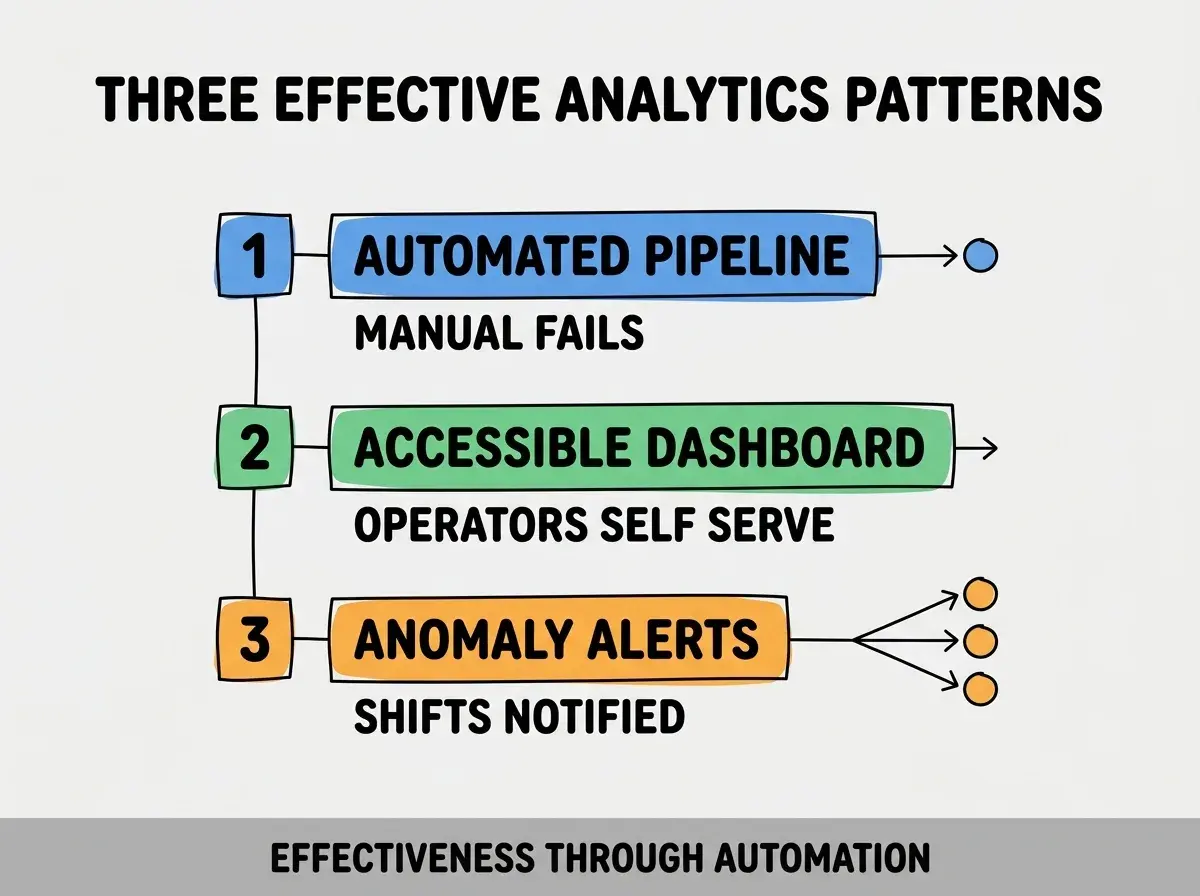
Pattern 1, automated pipeline. Manual fails over time.
Pattern 2, accessible dashboard. Operators self serve.
Pattern 3, anomaly alerts. Shifts notified.
The combination produces effective analytics. Without these patterns, analytics become bottleneck.
How To Choose Analytics Tools
Three patterns help tool choice.
Pattern A, platform native first. Shopify, WooCommerce analytics adequate to start.
Pattern B, custom for advanced. Custom dashboards for cohort and funnel analysis.
Pattern C, third party for benchmarking. Tools like Triple Whale provide comparative.
Common Questions About E-commerce Analytics
E-commerce analytics raise questions worth addressing directly.
The first question is what stack to use. Shopify analytics plus Looker Studio works for most; custom for advanced.
The second question is how to handle attribution. Multi touch attribution complex; first or last touch sufficient to start.
The third question is whether to track everything. No; focus on actionable metrics, ignore vanity.
The fourth question is how to handle returns in LTV. Subtract returns from lifetime revenue; net LTV reveals true value.
How Analytics Affect Growth Decisions
Analytics affect decisions in compounding ways. Decision effects compound across quarters.
The first compounding effect is investment allocation. Right channels get budget.
The second compounding effect is product decisions. Data informs roadmap.
The third compounding effect is retention focus. LTV awareness shapes retention investment.
The combination produces decisions shaped by analytics. Without analytics, decisions guess.
How To Validate Analytics Accuracy
Three patterns help validation.
Pattern A, cross check against platform. Custom dashboard matches platform totals?
Pattern B, manual sample audits. Pick orders; trace through dashboard.
Pattern C, segment splits add to total. Channel splits sum to overall?
The combination produces validated analytics. Without validation, dashboards misleading.
The most damaging e-commerce analytics mistake is tracking too many metrics. Operators overwhelmed by dashboards with 50 metrics make no decisions; focused dashboards with 5 metrics drive action. The fix is to start with funnel, AOV, LTV, cohorts; add metrics only when they answer specific questions. Stores with focused dashboards optimize quickly; stores with overloaded dashboards report data without acting on it.
The other mistake is missing the segmentation layer. Aggregate metrics hide channel and product variation.
A third mistake is over engineering pipeline. Simple often sufficient; complex pipelines fail to maintain.
A fourth mistake is treating analytics as report. Analytics should drive action, not produce reports.
Dig deeper
A few hand-picked sources if you want to go further.
What This Means For You
E-commerce analytics dashboards covering conversion funnels, AOV, and LTV give operators data to grow. The four categories, implementation patterns, and sustainability approaches produce analytics that compound growth decisions.
- If you're an e-commerce operator: Analytics central to growth; dashboard skills directly useful.
- If you're a marketer: Analytics inform marketing investment; understanding metrics essential.
- If you're changing careers: E-commerce analytics expertise valuable; transferable to other commerce contexts.
Browse more build
Read more build