Debugging without code skills sounds impossible, like performing surgery without medical training. But most debugging is not surgery. It is detective work. You are not rewriting the engine. You are looking at clues, following trails, and narrowing down what went wrong. Your browser already comes with a complete detective kit built in.
63% of people using vibe coding tools to build apps are not developers. They are marketers building landing pages, designers prototyping products, and creatives launching side projects. The AI writes the code beautifully. But when something breaks, these builders hit a wall. The app shows a blank screen, a button does nothing, or an image refuses to load.
You have a better option. Every modern browser ships with tools called DevTools that let you see exactly what is happening behind the scenes. Think of yourself as a detective. DevTools is your magnifying glass, your flashlight, and your fingerprint kit all in one. You do not need to understand the code. You just need to know where to look and what the clues mean.
Opening Your Detective Kit
The first step is opening Chrome DevTools. On a Mac, press Cmd + Option + I. On Windows or Linux, press Ctrl + Shift + I. You can also right-click anywhere on a page and select "Inspect" from the menu.
A panel will slide open on the right side of your browser window. It looks intimidating, full of tabs and colored text. Ignore most of it. You only need three tabs: Console, Network, and Elements. Those three are your magnifying glass, flashlight, and fingerprint kit.
Do not worry about breaking anything. DevTools only shows you information. You cannot damage your app by clicking around in these panels.
The Console Tab (Your Magnifying Glass)
Click the Console tab at the top of DevTools. This is where your browser reports every error it encounters. Think of it as a detective's evidence log. Every time something goes wrong, the browser writes a note here in red text.
Red text means an error. If your page is broken, there is almost certainly a red message waiting for you. You do not need to understand the technical details. What matters is the plain-English portion of the message, which usually includes a filename and a short description of what failed.
Here is what to do when you see a red error:
- Read the first line of the error message. Ignore the gray "stack trace" lines below it. The first line is the summary.
- Look for recognizable words. Terms like "undefined," "null," "not found," or "failed to fetch" tell you the category of problem even without code knowledge. "Not found" means something is missing. "Failed to fetch" means a request to a server did not work. "Undefined" means the app expected something that does not exist.
- Copy the entire error message. Select the red text, copy it, and save it. This is your single most valuable clue for getting help later.
92% of developers now use AI coding tools daily, and the error message you just copied is exactly what they paste into an AI assistant for a fix. You can do the same thing, no code degree required.
The Console tab is the single most useful debugging tool for non-coders. When something breaks, open it and look for red text. You do not need to understand the error. You just need to copy it. That one red message contains enough information for an AI assistant to diagnose the problem and suggest a fix in seconds.
The Network Tab (Your Flashlight)
Click the Network tab, then refresh the page. You will see a list of every request your app makes: loading images, fetching data, downloading fonts, pulling in stylesheets. Think of this as shining a flashlight into a dark room to see all the invisible activity behind the scenes.
Each row is one request. The columns that matter most are Status and Type.
Status codes are three-digit numbers that tell you whether a request succeeded or failed:
- 200 means success. Everything worked.
- 404 means "not found." The app asked for something that does not exist at that address. This is common when an image URL is wrong or a page was deleted.
- 500 means the server had an internal error. Something broke on the backend, not in your browser.
- 403 means "forbidden." The server refused the request, usually because of missing permissions or authentication.
To find problems quickly, look for rows highlighted in red or with status codes starting with 4 or 5. Those are your failed requests. Click any failed row to see details.
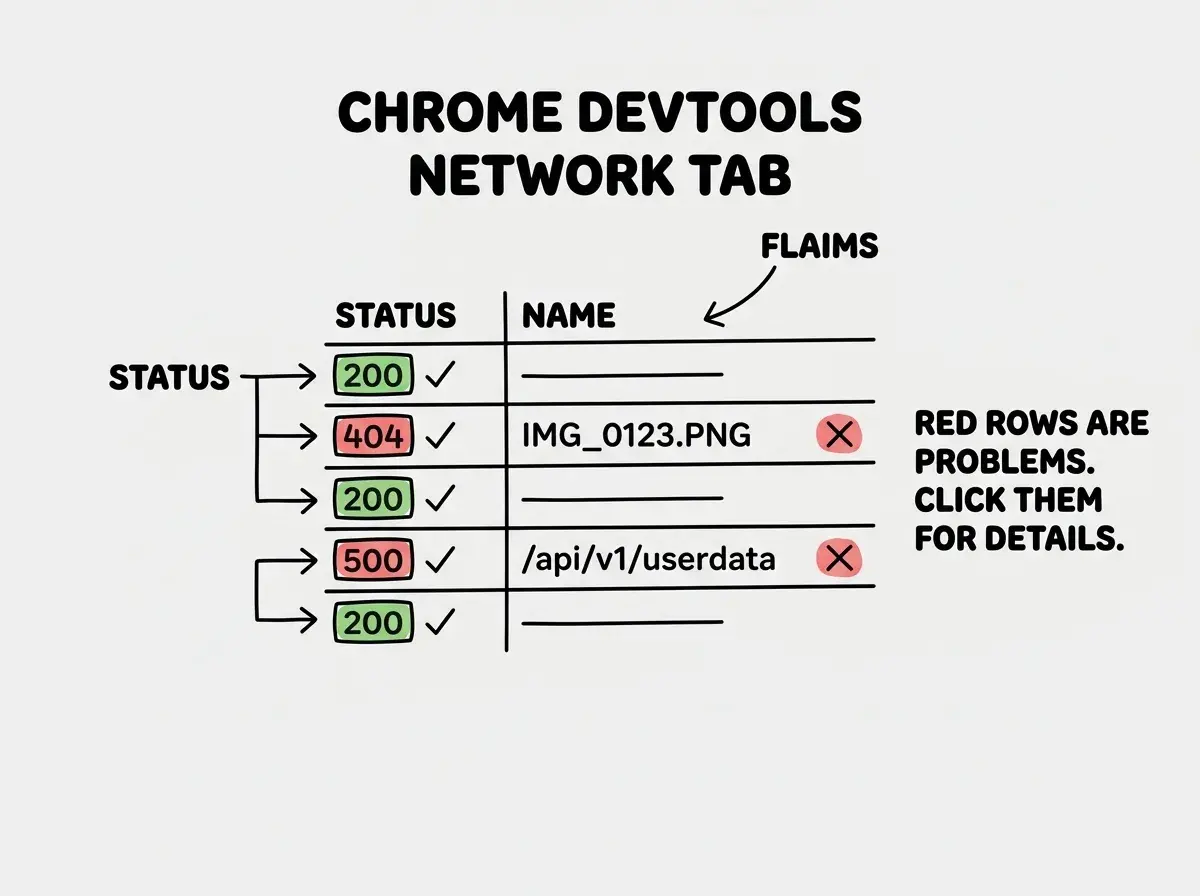
The Network tab is especially helpful for two common problems in vibe-coded apps: broken images and failed API calls. If images are missing, you will see 404 errors next to the image filenames. If a button does nothing, watch the Network tab while clicking it. If a new request appears in red, you found the problem.
The Elements Tab (Your Fingerprint Kit)
The Elements tab shows you the structure of the page. Every button, paragraph, image, and section is listed in a nested tree. This is your fingerprint kit, letting you examine every detail of how the page is built.
The most useful trick here is Inspect Element. Right-click anything on your page (a misaligned button, a broken layout, text that looks wrong) and select "Inspect." DevTools will jump directly to the code responsible for that element and highlight it in blue.
You do not need to read HTML to use this. Here is what to look for:
- Is the element actually there? Right-click where an image should be and Inspect. You can see if the image tag exists. If it does but is invisible, it might be hidden by a style rule.
- What styles are applied? On the right side, the "Styles" section shows every visual rule on the selected element. If something says
display: noneorvisibility: hidden, that is why you cannot see it. - What is the element's size? Hover over any element in the panel and the page highlights it with a colored overlay. Blue shows content, green shows padding, and orange shows margins. This helps you understand why elements overlap or why unexpected spacing appears.
Describing Problems to AI So It Can Actually Help
Now comes the part where debugging without code skills gets genuinely powerful. You have gathered clues from the Console, Network, and Elements tabs. The next step is describing the problem to an AI assistant so it can help you fix it.
Most non-coders describe problems like this: "My app is broken, please help." That gives the AI nothing to work with, like calling a detective and saying "a crime happened somewhere in the city." Instead, use this formula:
What I expected to happen + What actually happened + The error message or evidence
Here is a great example:
"I expected the signup button to take users to a confirmation page. Instead, clicking it does nothing. In the Console tab, I see this red error: TypeError: Cannot read properties of undefined (reading 'email'). In the Network tab, no request appears when I click the button."
That description gives an AI everything it needs: the feature (signup), the symptom (button does nothing), and the evidence (specific error plus absence of a network request). Nine times out of ten, the AI will respond with a specific fix.
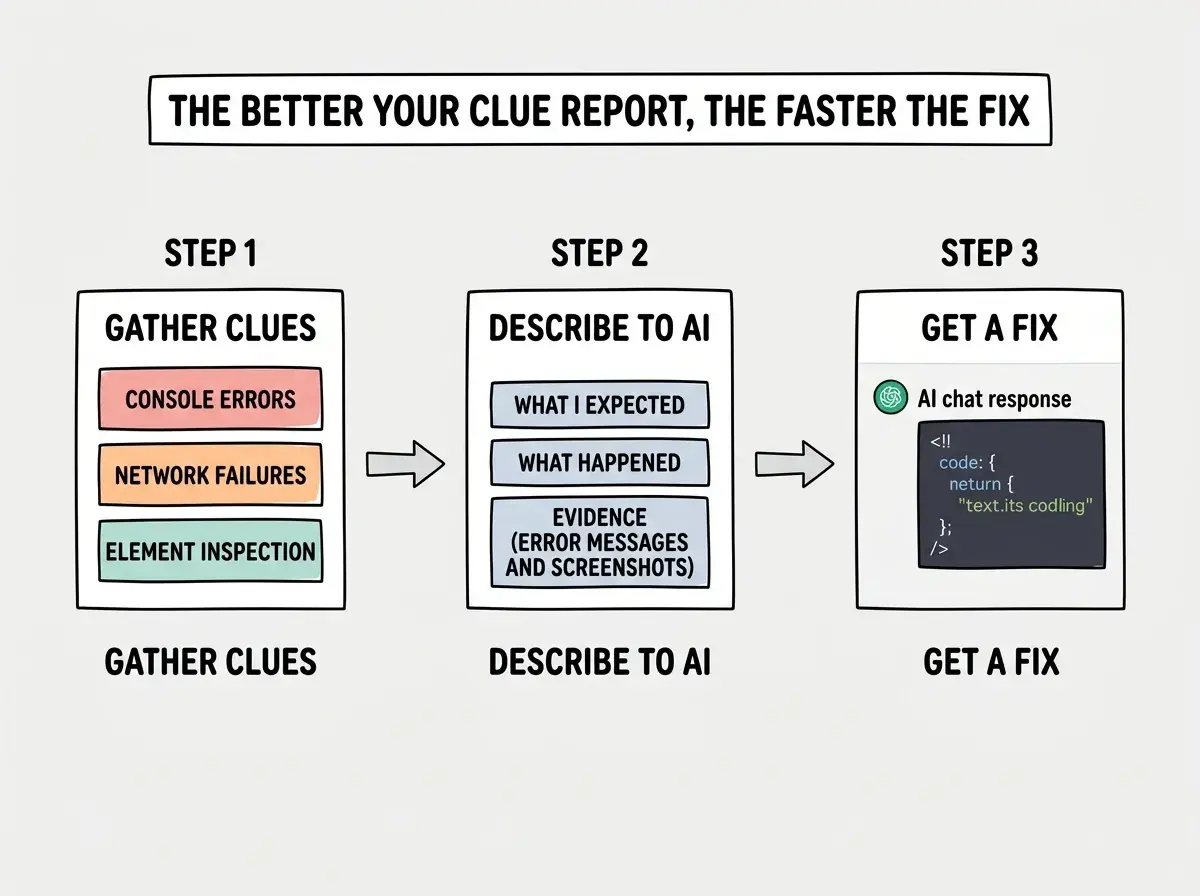
For visual problems, screenshots are your best friend. Take a screenshot of the broken page and another of the Elements tab showing the relevant code. Share both with the AI. Visual context helps it understand spatial problems that are hard to describe in words.
Start with the fundamentals before you need to debug anything.
Explore beginner guidesThe Inspect Element Trick for Understanding Layout
Here is a bonus technique designers especially love. You can use Inspect Element as an X-ray machine for any layout.
Right-click any section and select Inspect. In the Styles panel, look for display: flex, display: grid, or position: absolute. These are the layout instructions controlling where everything sits.
You can temporarily change values in the Styles panel to experiment. Click any number (a font size, a margin, a width) and use your arrow keys to adjust it. The page updates in real time. This does not change your actual code; it vanishes when you refresh. But it lets you figure out exactly which value needs to change, then tell your AI "change the margin-top on the hero section from 200px to 40px."
You are not writing code. You are observing, experimenting, and communicating what you found.
Closing DevTools and trying to describe the problem from memory. Error messages are precise, and paraphrasing them loses critical details. Always copy the exact error text and take screenshots before closing anything. Your memory of "something about a null value" is not enough. The exact message "TypeError: Cannot read properties of null (reading 'user')" tells an AI assistant exactly where to look.
Building Your Debugging Confidence
Debugging without code skills is not about memorizing what every error means. It is about knowing where to look, what to copy, and how to describe what you found. The Console shows errors. The Network tab shows failed requests. The Elements tab shows page structure. AI turns your clues into fixes.
Every detective gets faster with practice. The first time you open DevTools, it will feel foreign. By the fifth time, you will reach for it instinctively. That reflex to investigate instead of panic is what separates builders who ship from builders who stall.
What This Means For You
- If you are a marketer: You can now diagnose landing page issues yourself instead of filing a ticket and waiting two days. Open the Console, grab the error, hand it to an AI, and have a fix ready before lunch.
- If you are a designer: The Elements tab gives you direct insight into how CSS affects layout. Experiment with spacing and sizing in real time, then communicate exact values to your AI tool. No more guessing what "make it less cramped" means in code terms.
- If you are a creative building a side project: Debugging turns "I tried to build something but it broke" into "I built something, it broke, and I fixed it." That difference is everything. The detective kit is already in your browser.
Pick a project idea and start building with AI tools today.
Browse project tutorials