Every web app has a hidden layer that you never see as a user. The colors, the buttons, the layout, the data flying back and forth between your browser and a server somewhere. It is all happening right there, and you can watch it in real time. Browser DevTools gives you X-ray vision for your app. It lets you see through the surface of your web app to the bones underneath, the structure, the errors, the network requests, the stored data.
With 92% of developers now using AI tools daily, vibe coders are shipping faster than ever. But shipping fast also means debugging fast, and DevTools is the single most useful debugging tool already installed on your computer. You do not need to download anything. You do not need to configure anything. It is sitting inside Chrome right now, waiting for you to open it.
This tutorial covers the four DevTools tabs that actually matter for vibe coders, with step-by-step instructions for each one. By the end, you will know how to inspect any element on a page, catch errors before your users do, watch your API calls in real time, and check what data your app is storing locally.
Opening DevTools for the First Time
On Mac, press Cmd + Option + I. On Windows or Linux, press Ctrl + Shift + I. You can also right-click any element on a webpage and select "Inspect" from the context menu, which opens DevTools and highlights the element you clicked.
When DevTools opens, you will see a panel appear either at the bottom or the right side of your browser window. It looks intimidating. Dozens of tabs, buttons, and panels. Ignore almost all of them. You only need four tabs.
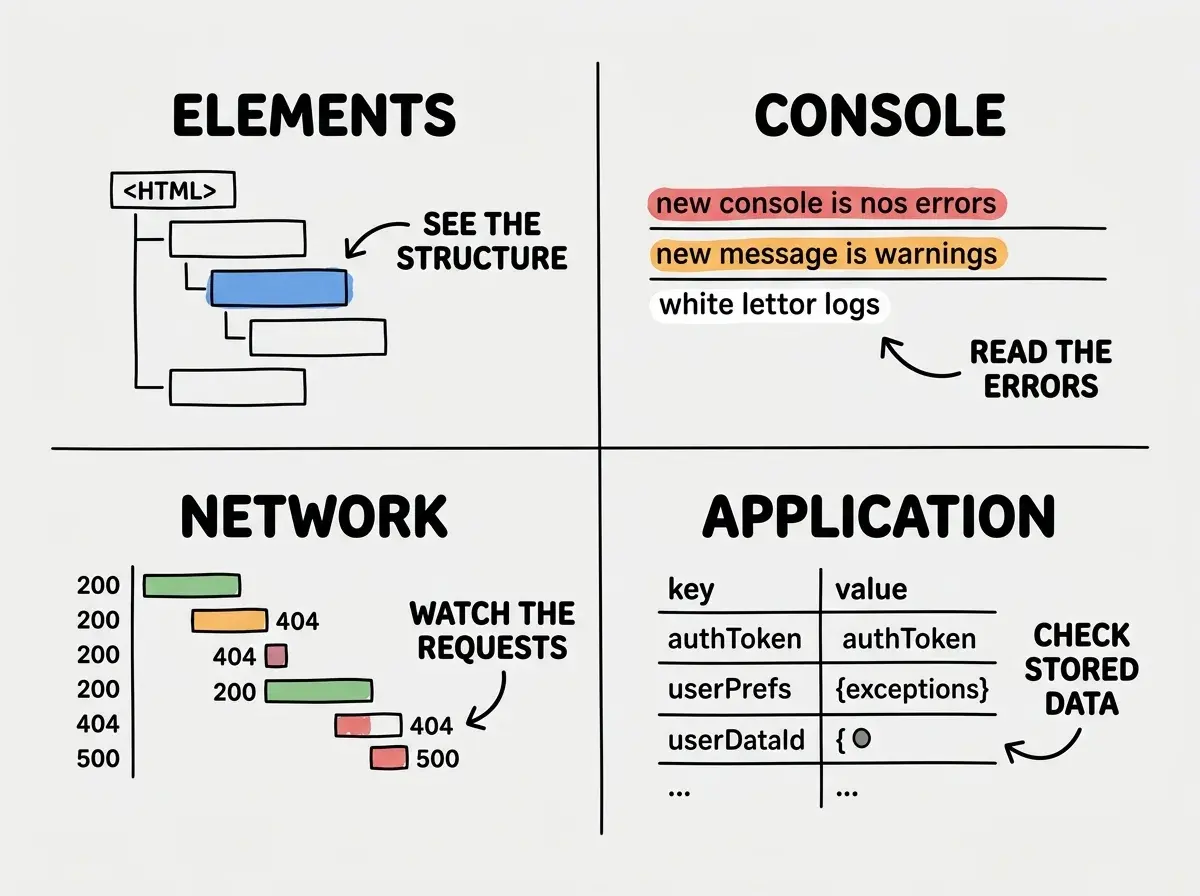
DevTools is your X-ray vision for any web app. You do not need to understand every tab or every panel. The four tabs covered here (Elements, Console, Network, Application) handle 95% of the debugging situations a vibe coder will encounter. Open it with Cmd + Option + I on Mac or Ctrl + Shift + I on Windows and start exploring.
Tab One, Elements
The Elements tab is where you see the skeleton of your webpage. Every button, heading, image, and div, laid out in a tree structure called the DOM. This is X-ray vision in its most literal form. You are looking at the bones of your page.
Click the Elements tab at the top of DevTools. You will see HTML code on the left and CSS styles on the right. Hover over any line of HTML, and the corresponding element highlights on the page in blue. This works in reverse too. Click the small cursor icon in the top-left corner of DevTools (or press Cmd + Shift + C), then hover over anything on your webpage. The Elements panel will jump to that exact element.
This is useful when something looks wrong visually. A button is the wrong color, a heading is too small, there is mystery spacing around an element. Click on the element, look at the Styles panel on the right, and you can see every CSS rule affecting it. You can even edit styles temporarily right in DevTools to test fixes before changing your actual code.
When you will use this. Your AI tool generated a page, but a section has weird padding. Click the element, find the padding or margin property in the Styles panel, and change it to see what looks right. Then tell your AI exactly what value to use.
Tab Two, Console
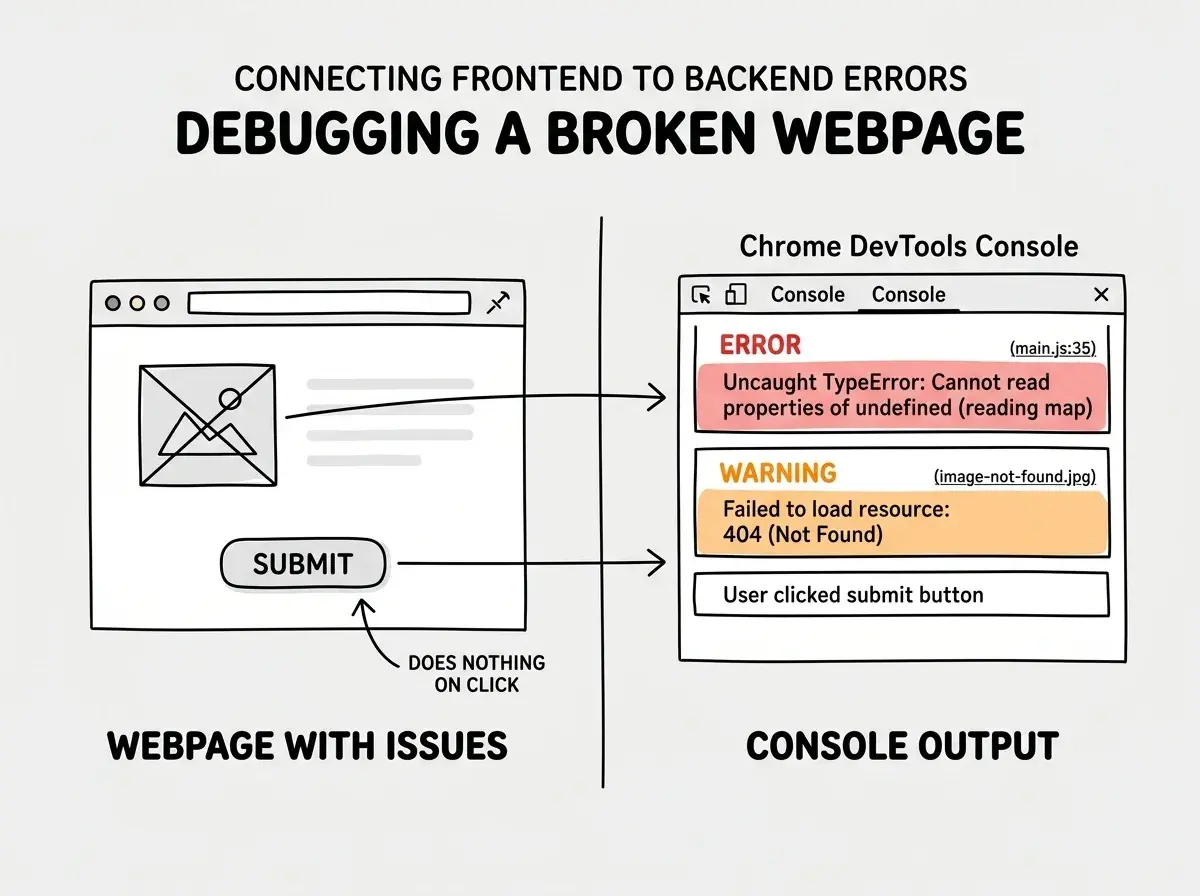
The Console tab is your app's diary. Every error, every warning, every message your code logs shows up here. If something is broken and you cannot figure out why, the Console almost always has the answer.
How to use it, step by step.
Click the Console tab. If your app has errors, you will see them immediately in red text. Each error message includes a file name and line number on the right side, telling you exactly where the problem is. Orange text means warnings, which are not breaking anything yet but might cause problems later.
The most common errors you will see as a vibe coder are TypeError (trying to use something that does not exist), ReferenceError (using a variable that was never defined), and 404 Not Found (trying to load a resource at a URL that does not exist).
When you will use this. You deployed your app but a feature is not working. Open the Console, look for red errors, and copy the error message directly into your AI tool. Something like "I am getting this error in the Console: [paste error]. How do I fix it?" This is one of the fastest debugging workflows that exists.
Tab Three, Network
The Network tab shows you every request your browser makes. Every image it loads, every API call it sends, every stylesheet it fetches. If your app talks to a backend or a third-party service, this is where you watch that conversation happen.
How to use it, step by step.
Click the Network tab, then refresh your page. You will see a waterfall of requests appear, one row for each file or API call. Each row shows the request name, status code, type, size, and how long it took. The status code is the most important column. A 200 means success. A 404 means not found. A 500 means the server had an error. A 401 or 403 means you are not authorized.
Click on any row to see its full details. The Headers sub-tab shows what was sent. The Response sub-tab shows what came back. For API calls, the Response tab is gold, showing you the exact JSON data your app received.
When you will use this. Your app should show a list of items from an API, but the list is empty. Open the Network tab, find the API request, check the status code and response data. If the response is empty, the problem is server-side. If the response has data but the page is blank, the problem is in your frontend code.
Tab Four, Application
The Application tab is where your app keeps its local stuff. Cookies, localStorage, sessionStorage, and cached files. This is less glamorous than the other tabs, but it saves you when you are dealing with authentication issues, persistent settings, or data that seems stuck.
Click the Application tab. In the left sidebar, you will see Storage sections. Click on "Local Storage" and then your site's URL to see everything stored locally. This is where apps keep user preferences, authentication tokens, and cached data. You can click any entry to see its value, edit it, or delete it. Cookies work the same way under the "Cookies" section.
When you will use this. You are logged into your app but it keeps acting like you are not authenticated. Check the cookies or localStorage for your auth token. If it is missing, the login flow has a bug. If it is present but you are still getting 401 errors in the Network tab, the token might be expired. You can delete all stored data from here to start fresh, the DevTools equivalent of "turn it off and turn it back on."
A Real Debugging Workflow
Let me show you how these four tabs work together. Imagine you have built a todo app with your AI tool. It loads fine, but when you click "Add Task," nothing happens.
Step 1. Open DevTools and check the Console. You see a red error: TypeError: Cannot read properties of null (reading 'value'). This tells you the code is trying to read a value from something that does not exist.
Step 2. Copy the full error and paste it into your AI tool with context about what you were doing. The file reference in the error tells you exactly where to look.
Step 3. Check the Network tab. Did the action send an API request? If there is no request, the error happened before the app tried to save. If there is a request with a 500 status, the server is the problem.
Step 4. Check the Application tab. Is the todo list stored in localStorage? Sometimes clearing localStorage and refreshing fixes issues caused by old data formats.
This sequence, Console first, then Network, then Application, then Elements for visual issues, resolves the majority of bugs you will encounter. It takes less than a minute once you know where to look.
Ignoring the Console and trying to guess what is wrong. Many vibe coders see a broken feature and immediately start changing code or re-prompting their AI tool. Before you change anything, open the Console. The error message is almost always there, telling you exactly what broke and where. Copy that error message into your AI tool and you will get a targeted fix instead of a random guess.
Making DevTools Part of Your Workflow
The best time to open DevTools is not when something breaks. It is while you are building. Keep DevTools open in a side panel during development. Watch the Console for errors as they appear. Monitor the Network tab to make sure API calls succeed. This is your X-ray vision running continuously, catching problems the moment they happen instead of after you have shipped them.
You do not need to become a DevTools expert. You need to become comfortable enough to open it, check the four tabs, and extract the information your AI tool needs to fix the problem. That is the vibe coder superpower. Not knowing how to fix everything yourself, but knowing how to find the clue that unlocks the fix.
DevTools is not a tool for professional developers only. It is a tool for anyone who builds on the web. Now that you know where to look, you have X-ray vision too. Open it up and start seeing your app the way your browser sees it.