You pushed your code, the deploy kicked off, and then it failed. You stare at a wall of terminal output and have no idea what went wrong. This is one of the most frustrating moments in shipping software, and it happens to everyone. 92% of developers now use AI daily, but even the best AI tools cannot help you if you do not know what to paste into them. The fix starts with reading your build logs.
Think of build logs like a plane's flight recorder. Every commercial aircraft carries a black box that records everything that happened before a crash. Investigators do not guess what went wrong. They pull the recorder, read the data, and find the exact moment things broke. Your build logs work the same way. Every command that ran, every file that was processed, every error that fired is recorded in sequence. You just need to know how to read it.
Where to Find Your Build Logs
Every hosting platform stores build logs in a slightly different place, but they all follow the same pattern. You trigger a deploy, the platform runs your build, and the output goes into a log viewer.
On Vercel, click into your project, go to the Deployments tab, and click any deployment. The build log appears as a scrollable output panel. Failed deploys show a red badge, and you can expand individual build steps to isolate where the failure happened.
On Cloudflare Pages, navigate to your project in the dashboard, click the failed deployment, and the log opens inline. Cloudflare also shows a summary line at the bottom telling you which step failed, which saves you from scrolling through hundreds of lines.
On Netlify, the deploy log lives under the Deploys tab in your site dashboard. Click the failed deploy, and you get a full terminal-style output. Netlify highlights errors in red, which makes scanning easier.
The location varies, but the skill is the same everywhere. Find the log, scroll to the error, and read what it says. That is the flight recorder data you need.
Anatomy of a Build Log
Build logs follow a predictable structure with three main phases. Understanding these phases tells you immediately where to look when something breaks.
Phase 1, Install. The platform installs your dependencies. You will see npm install or yarn install or pnpm install running, followed by a tree of packages being resolved and downloaded. Failures here usually mean a dependency could not be found, a version conflict exists, or your lockfile is out of sync.
Phase 2, Build. Your framework compiles your code. For a Next.js app, this is where next build runs. TypeScript gets type-checked, pages get rendered, API routes get bundled. This phase produces the most errors because it is where your actual code gets tested against the compiler.
Phase 3, Deploy. The platform takes your compiled output and pushes it to its edge network or servers. Failures here are less common but usually involve output size limits, missing configuration, or platform-specific constraints.

When your flight recorder shows a crash, the first thing to check is which phase it happened in. An error during install means your dependencies are the problem. An error during build means your code is the problem. An error during deploy means your platform configuration is the problem.
The Ten Most Common Build Failures
After shipping dozens of projects across multiple platforms, these are the ten errors you will see most often. Each one has a clear signature in the logs and a straightforward fix.
1. Missing dependency. The log says Module not found: Can't resolve 'some-package'. You imported something that is not in your package.json. Fix it by running npm install some-package and pushing again.
2. Missing environment variable. Your code references process.env.SOME_KEY, but the platform does not have it set. The log might show undefined errors or API calls failing during static generation. Go to your platform's environment variable settings and add the missing key.
3. TypeScript type errors. Lines like Type 'string' is not assignable to type 'number' appear in the build phase. These pass locally if you skip type checking during development. Fix the types or, as a temporary escape hatch, add // @ts-expect-error with a comment explaining why.
4. Memory limit exceeded. The build process gets killed with FATAL ERROR: Reached heap limit or just Killed. This happens with large sites or heavy image processing. Increase the memory allocation in your platform settings, or optimize your build to process fewer pages at once.
5. Lockfile mismatch. The log warns about inconsistencies between package.json and your lockfile. Delete node_modules and your lockfile locally, run a fresh install, commit the new lockfile, and push.
6. Node.js version mismatch. Some packages require a specific Node version. The log might say SyntaxError: Unexpected token on code that works locally. Set the Node version explicitly in your platform settings or add an .nvmrc file to your repo.
7. Build output too large. Cloudflare Workers have a size limit. Vercel has limits on serverless function size. The log tells you the actual size versus the allowed maximum. Reduce your bundle by removing unused dependencies or splitting your code.
8. Import path errors. Case-sensitive file systems on Linux servers catch what macOS ignores. You wrote import Header from './header' but the file is actually Header.tsx. The log shows Module not found with a path that looks correct but is not.
9. Static generation failures. During next build, pages that fetch data at build time can fail if APIs are unreachable or return errors. The log shows the specific page path and the fetch error. Make sure your APIs are accessible from the build environment and handle errors gracefully.
10. Missing build command or output directory. The platform does not know how to build your project. The log says something like Build command returned non-zero exit code or the deploy phase cannot find the output. Check your platform settings for the correct build command (next build, npm run build) and output directory (.next, out, build).
Most build failures fall into one of these ten categories. Before you start searching forums or asking AI for help, check whether your error matches one of these patterns. The fix is usually a one-line change or a single platform setting adjustment. Your flight recorder almost always points to one of these known failure modes.
How to Read the Error Message
When a build fails, the platform dumps hundreds or thousands of lines of output. Most of it is noise. Here is how to find the signal.
Start from the bottom of the log and scroll up. The final error message is usually the most relevant one. Build tools often cascade, meaning one error triggers ten more. The root cause is the first error, but the last message before the build stopped is your best starting point.
Look for lines that contain error, Error, ERR!, or FATAL. Most platforms highlight these in red. Ignore warnings unless the log says "warnings treated as errors," which some strict configurations enable.
Pay attention to file paths and line numbers. The error ./src/components/Header.tsx:42:5 tells you the exact file and line. That specificity is gold. Open that file, go to that line, and the problem is usually obvious once you see it in context.
Do not copy the entire build log and paste it into ChatGPT or Claude. The AI will get lost in hundreds of irrelevant lines and give you a generic answer. Instead, copy only the specific error message, the file path, and five to ten lines of surrounding context. A focused paste gets you a focused answer every time.
If the error message is cryptic, search for the exact text in quotes on Google or your preferred search engine. Someone else has almost certainly hit the same error, and the first Stack Overflow or GitHub issue result usually has the fix.
Copying the Right Error for AI to Fix
AI coding tools are incredibly good at fixing build errors, but only if you give them the right information. Think of it like handing the flight recorder data to an expert investigator. They need the relevant section, not the entire recording.
Here is the process that works consistently. First, identify the error line using the techniques above. Second, copy the error message itself plus five to ten lines above it for context. Third, include the file path and line number if the log provides them. Fourth, paste that into your AI tool with a simple prompt like "My deploy failed with this error. How do I fix it?"
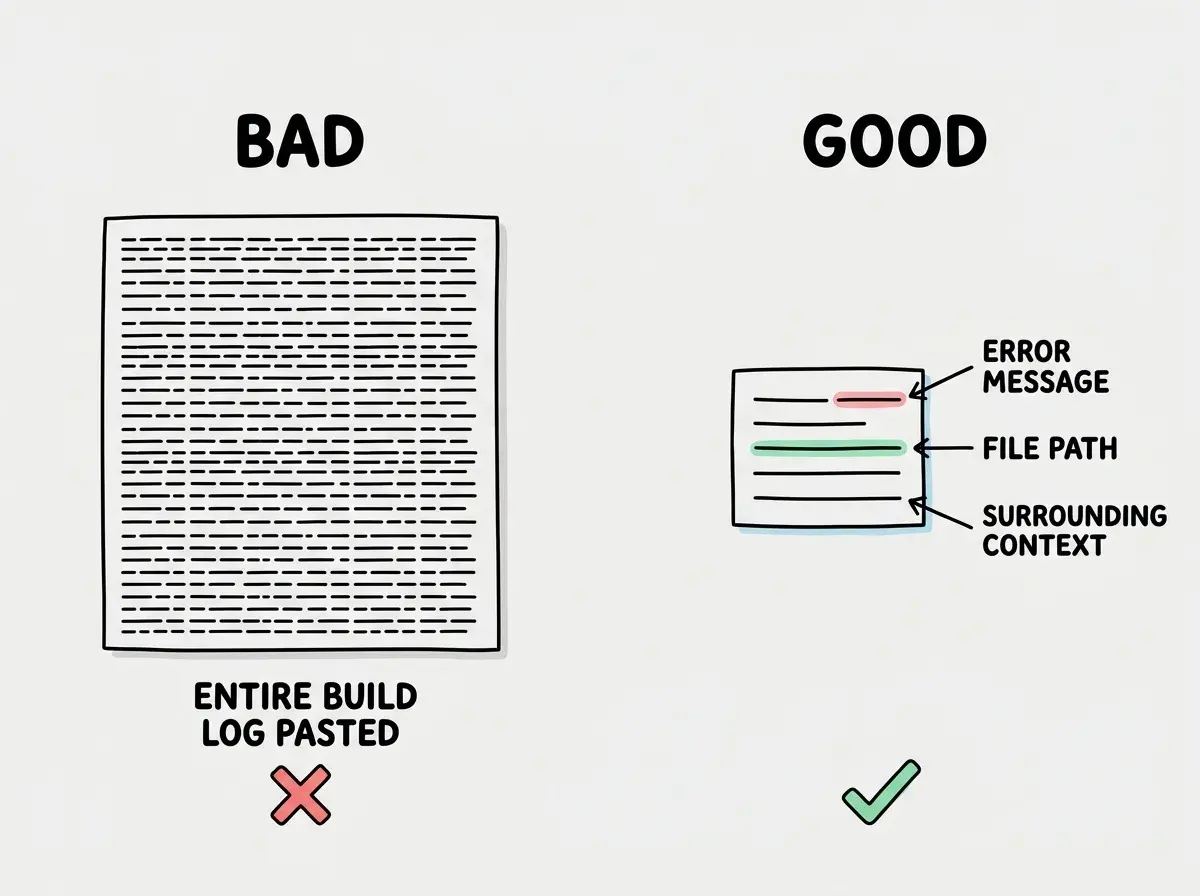
The AI can usually identify the problem and suggest a fix within seconds. For TypeScript errors, it will give you the corrected type. For missing dependencies, it will tell you exactly what to install. For environment variable issues, it will point out which variable is missing and where to set it.
This workflow turns a frustrating 30-minute debugging session into a 2-minute copy-paste-fix cycle. The flight recorder has the data. The AI is the expert investigator. Your job is just to connect the two with the right excerpt.
Learn the workflows and tools that make deploying your projects predictable instead of painful.
Explore the fundamentalsBuilding Your Debugging Instinct
After you have fixed a few build failures, you start recognizing patterns before you even read the full log. You see the build failed at the install phase and immediately check your lockfile. You see it failed during static generation and check your environment variables. The flight recorder data becomes familiar, and you stop dreading it.
Keep a simple document where you log every build failure you hit and how you fixed it. After ten entries, you will notice that the same five problems account for 90% of your failures. That document becomes your personal runbook, and it makes every future failure faster to resolve.
The developers who ship consistently are not the ones who never have build failures. They are the ones who fix them in minutes instead of hours. Reading build logs is the skill that makes that possible.
Get practical tutorials on building and deploying real products with AI coding tools.
Browse all tutorialsDeployment failures feel like a wall until you learn to read the flight recorder. Once you do, every failure becomes a puzzle with an answer sitting right there in the logs. Find the phase, find the error, copy the right lines, and let your AI tool do the rest. That is the entire process, and it works every single time.