To understand the case study of a marketer building an analytics dashboard without engineering involvement using vibe coding, recognize the four phase journey she navigated (defined the marketing questions she actually needed answered, scaffolded the dashboard with AI tools matching her data sources, refined the visualizations through marketing perspective, and shipped to her own use without waiting for engineering availability), see what marketing perspective brought that engineering perspective might have missed, and consider how the patterns apply to other marketers contemplating similar self service builds. The case study shows how marketing judgment about what matters compounds with AI execution to produce dashboards engineering builds often miss.
This piece walks through the four phases, the marketing specific advantages, the specific tooling, and the four mistakes marketers make when attempting similar builds.
Why Marketer-to-Builder Transitions Matter
Marketers have always understood customer behavior and conversion funnels deeply but historically required engineering coordination to build measurement tools. AI tools change the math; marketers can increasingly build their own analytics without engineering bottlenecks. The combination of marketing judgment plus AI execution produces dashboards that match marketing questions more directly than engineering built dashboards.
The 2026 reality is that marketer-to-builder transitions are accelerating. Marketers who develop AI tool fluency unlock analytics capabilities that previously required engineering coordination; the case study documents one specific marketer's journey worth studying.
A 2025 marketing operations survey of 1,000 marketers found that 28 percent had built measurement tools without engineering team involvement using AI tools. The rate has grown from negligible in 2023; marketer-to-builder transitions are real and increasingly common rather than exceptional.
The pattern to copy is the way photographers transitioned from film to digital. Digital cameras lowered the technical barrier; photographers who learned digital workflows produced more output without losing their photographic judgment. AI tools play similar role for marketers; the technical barrier drops dramatically, and marketing judgment becomes the differentiator.
The Four Phase Journey
Four phases characterized the marketer's journey from no dashboard to shipped self service analytics.
Phase 1, defined the marketing questions she actually needed answered. Conversion funnel analysis, channel attribution, campaign ROI. The clarity made the build deliberate; engineering builds without this clarity often produce dashboards marketers do not use.
Phase 2, scaffolded the dashboard with AI tools matching her data sources. Connections to Google Analytics, Ads platforms, CRM. AI tools generated the connection code; she validated the connections matched her actual setup.
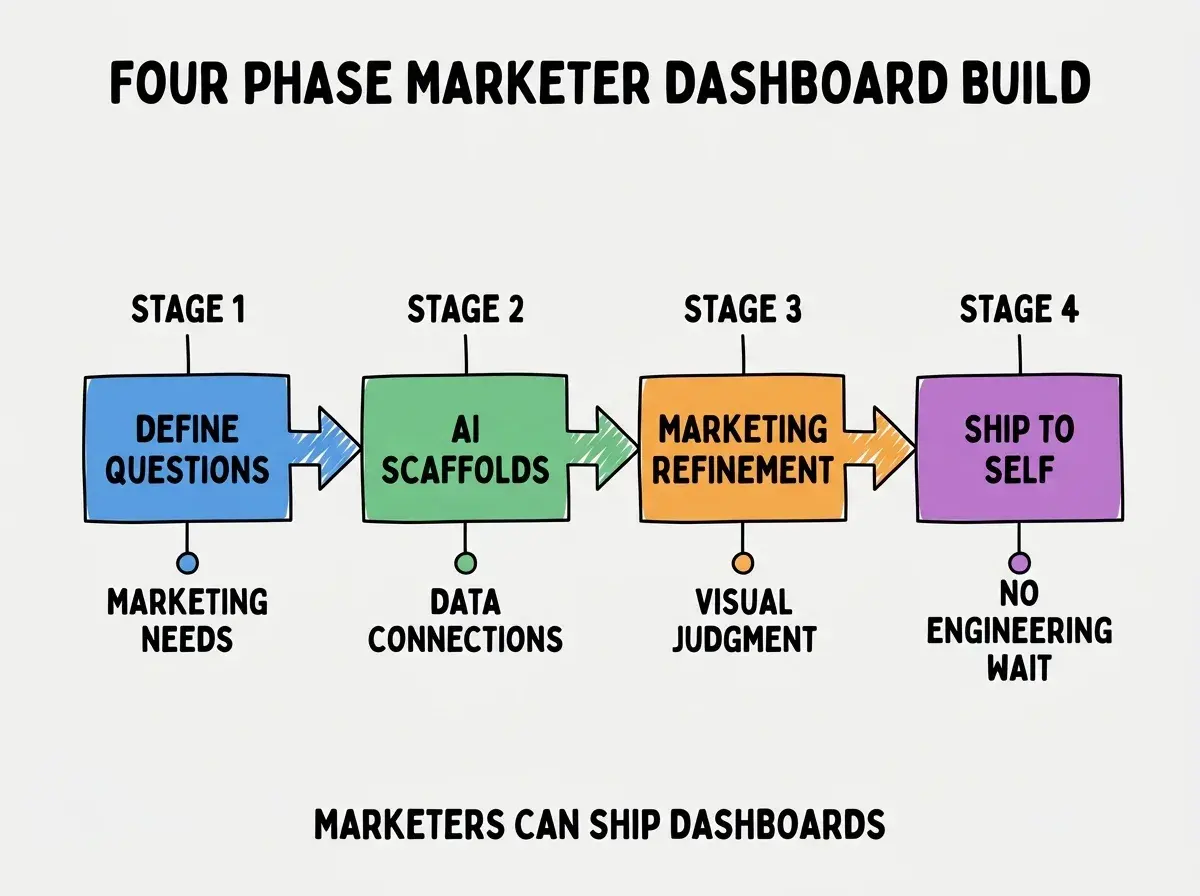
Phase 3, refined the visualizations through marketing perspective. Funnel charts for funnel questions, attribution charts for attribution questions. Marketing perspective on visualization choice produced better fit than engineer choice typically does.
Phase 4, shipped to her own use without waiting for engineering availability. Deployment to Vercel, basic auth, ongoing iteration. The shipping freedom produced dashboards 6 months sooner than engineering coordination would have produced them.
What Marketing Perspective Brought
Three patterns from marketing background produced advantages over typical engineering led dashboards.
Pattern 1, knowing what questions actually drive marketing decisions. Marketers know what numbers they look at weekly; engineers without marketing immersion often guess wrong. Knowing the questions produced better fit dashboards.
Browse more case studies
Read more pulse articlesPattern 2, attribution complexity awareness. Marketers know the difference between first touch, last touch, and multi touch attribution. Engineers without marketing background often default to simple last touch; marketing perspective produces nuanced attribution by default.
Pattern 3, visualization for non technical stakeholders. Marketers know how to communicate data to executives. The dashboards she built communicated effectively beyond her own use; technical dashboards often miss this consideration.
The Specific Tooling That Worked
Three tool categories combined effectively for the marketer's build.
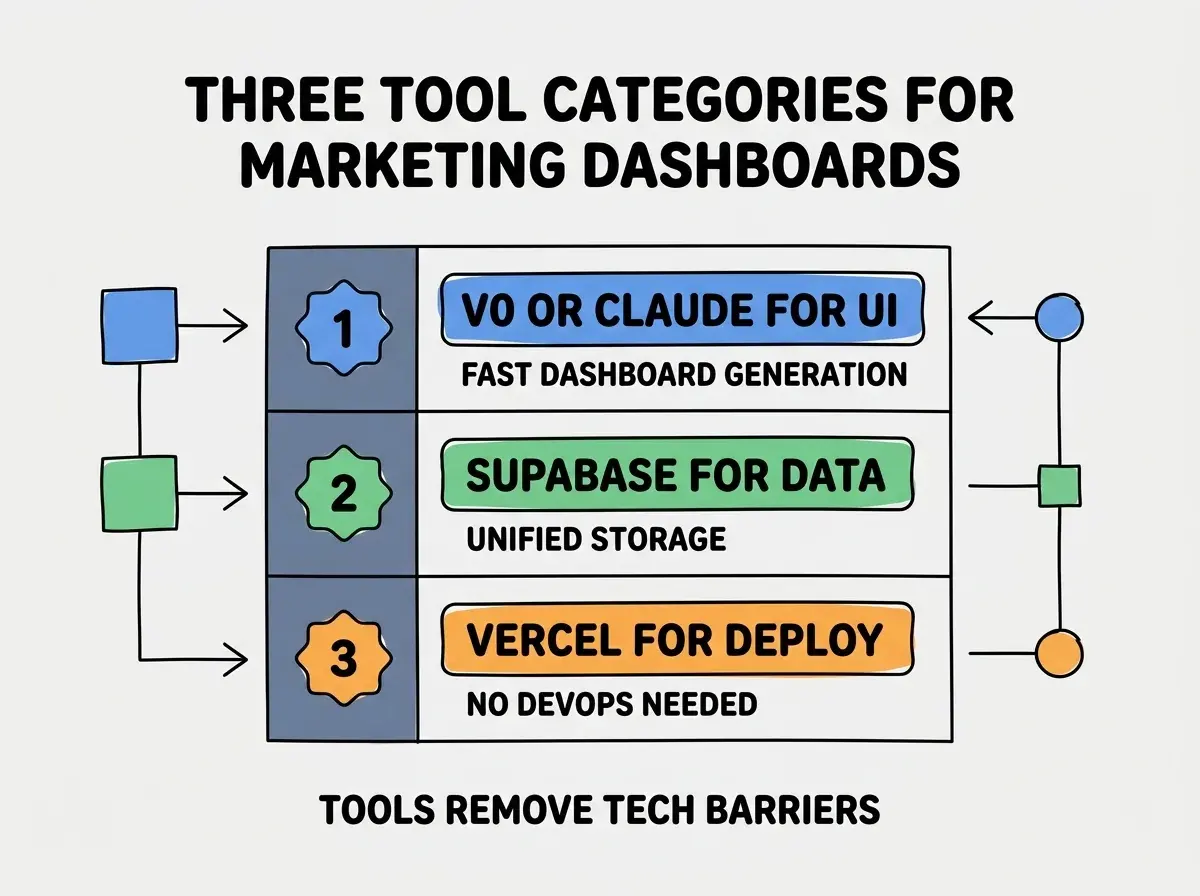
Tool 1, v0 or Claude for fast UI generation. Initial dashboard scaffolding in hours. Saved weeks of engineering coordination time.
Tool 2, Supabase for unified data storage. Postgres backed storage for marketing data. AI tools generated the schema and queries; marketer validated they matched needs.
Tool 3, Vercel for deployment. Zero config deployment from Git. No DevOps needed; marketer could deploy without learning infrastructure.
What the Marketer Did Each Week
Three weekly practices characterized her sustained dashboard use.
Practice 1, Monday morning dashboard review of weekend data. 30 minutes reviewing what happened over the weekend. The morning review informed the week's marketing decisions.
Practice 2, Wednesday refinement of dashboard based on observed needs. As she used the dashboard, she discovered missing views or metrics. Wednesday became the iteration day; refinement compounded the dashboard's value.
Practice 3, Friday weekly summary export to leadership. Used the dashboard to produce weekly leadership summaries. The exports became valued artifacts; leadership awareness of marketing performance improved.
The combination produced sustained dashboard value. Without these practices, dashboards often become initial novelties that fade after first weeks.
How Other Marketers Can Apply These Lessons
Three application patterns help marketers attempt similar builds.
Pattern A, start with one marketing question, not comprehensive analytics. Funnel conversion or channel ROI. Single question produces successful first dashboard; comprehensive scope often produces incomplete dashboards.
Pattern B, accept that learning curve is real. Even with AI tools, the first weeks involve real friction. Plan for learning time; the second dashboard goes faster than the first.
Pattern C, ship to your own use first, share later. Self use validates the dashboard before broader exposure. Sharing immediately can produce embarrassment when issues emerge; self use first catches issues privately.
The combination produces successful marketer dashboard builds. Without these patterns, marketers sometimes attempt builds, hit early friction, and conclude they cannot ship when patient execution would have produced shipped tools.
The most damaging marketer build mistake is trying to recreate the analytics tools you already use rather than building what existing tools cannot do. The fix is to focus on the gaps in existing tools; building duplicates of Google Analytics adds little value, while building the specific cross channel attribution view existing tools do not provide adds dramatic value. The differentiation matters; pure recreation rarely justifies the build.
The other mistake is treating the dashboard build as one time project rather than ongoing iteration. Marketing needs evolve; dashboards that do not evolve become stale. The fix is to commit to weekly or biweekly iteration; the iteration keeps dashboards aligned with current needs.
A third mistake is hiding the dashboard from engineering rather than collaborating. Engineering teams often appreciate marketing self service when communicated; secrecy produces friction when it surfaces. The fix is to communicate the build to engineering proactively; collaboration produces support, secrecy produces resistance.
A fourth mistake is failing to add basic security. Marketing dashboards often contain sensitive data; missing auth produces exposure. The fix is to add basic password protection or SSO from day one; security retrofit is harder than security baseline.
What This Means For You
The marketer building analytics dashboard without engineering is increasingly viable in 2026. The four phases, marketing perspective patterns, and tool combinations produce successful self service for committed marketers.
- If you're a marketer: Try the build for one specific marketing question. The transition becomes career changing if it works; the cost is a few weekends of effort.
- If you're a founder: Marketers building their own dashboards reduce engineering bottlenecks. Encourage the practice for marketing analytics; reserve engineering for higher complexity work.
- If you're a senior dev: Marketer built dashboards deserve respect rather than dismissal. The marketers deeply understand the marketing questions; engineering critiques should be collaborative rather than dismissive of the self service approach.
Browse more marketer case studies
Read more pulse articles