To build a product roadmap visualizer for PMs in a weekend, focus on three views that different stakeholders actually use (timeline view for executives, swim lane view for cross-team alignment, kanban view for active sprint context), pull data from your issue tracker (Linear, Jira, GitHub Issues), and keep the visualization automatically synced rather than manually updated. The tool ships in two days of focused work and produces a roadmap that stays accurate without the maintenance overhead that kills most roadmap tools.
This piece walks through the three views, the data integration patterns, the auto-refresh architecture, and the four mistakes that turn roadmap tools into static slides everyone ignores.
Why Roadmaps Get Stale So Fast
Most product roadmaps are built once, presented once, and never updated. The reason is that updating them requires manual work: editing slides, copying data from issue trackers, reformatting for stakeholders. The maintenance cost is high enough that PMs default to letting the roadmap drift.
The 2026 opportunity is to build a roadmap that pulls live from your existing data sources. The PM does not maintain the roadmap; the roadmap reflects the source of truth automatically. This eliminates the maintenance work that makes roadmaps go stale.
A 2025 Aha! survey of 800 product teams found that 71 percent of teams reported their roadmap was "out of date most of the time." Of those, 89 percent had manually-maintained roadmaps. Of the 29 percent with up-to-date roadmaps, 78 percent had automated sync from their issue tracker. The data is clear: maintenance burden determines whether roadmaps stay accurate, and automation is the only sustainable solution.
The pattern to copy is the way modern dashboards replaced manually-updated reports. Reports were always out of date because someone had to update them; dashboards stay current because they pull from live data. Roadmaps need the same shift.
The Three Views Stakeholders Actually Use
Different stakeholders need different views of the same data. A good roadmap tool serves all three.
View 1, timeline. Quarterly or monthly horizons with major initiatives. For executives and external stakeholders. Optimized for "where are we headed" questions.
View 2, swim lane. Each team or workstream as a row, with their work plotted across time. For cross-team alignment. Optimized for "what is everyone working on" questions.
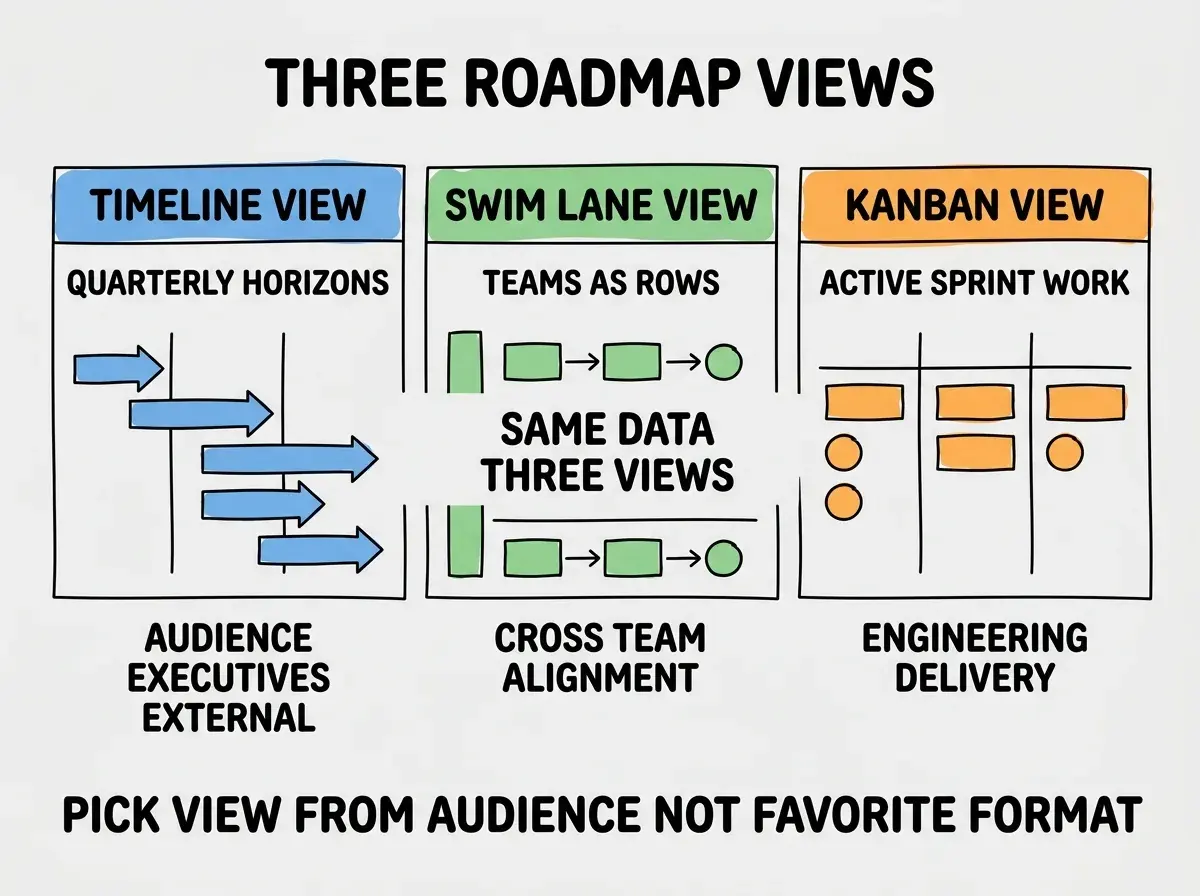
View 3, kanban. Active sprint work in progress, ready, and blocked. For engineering and delivery teams. Optimized for "what should I pick up next" questions.
The Auto-Refresh Architecture
The auto-refresh is what makes the roadmap sustainable. Three pieces handle the integration.
Piece 1, issue tracker integration. Pull issues from Linear, Jira, or GitHub Issues via their APIs. Webhook for real-time updates, plus periodic backup sync.
Browse more PM build guides
Read more build articlesPiece 2, classification layer. Map issues to roadmap items via labels, milestones, or custom fields. The mapping is the only manual part PMs maintain.
Piece 3, view rendering. Render the same data into the three views using a charting library (recharts, Visx, or even D3 for advanced cases).
How to Keep the Roadmap Useful
Three additional patterns separate roadmaps that drive decisions from those that just exist.
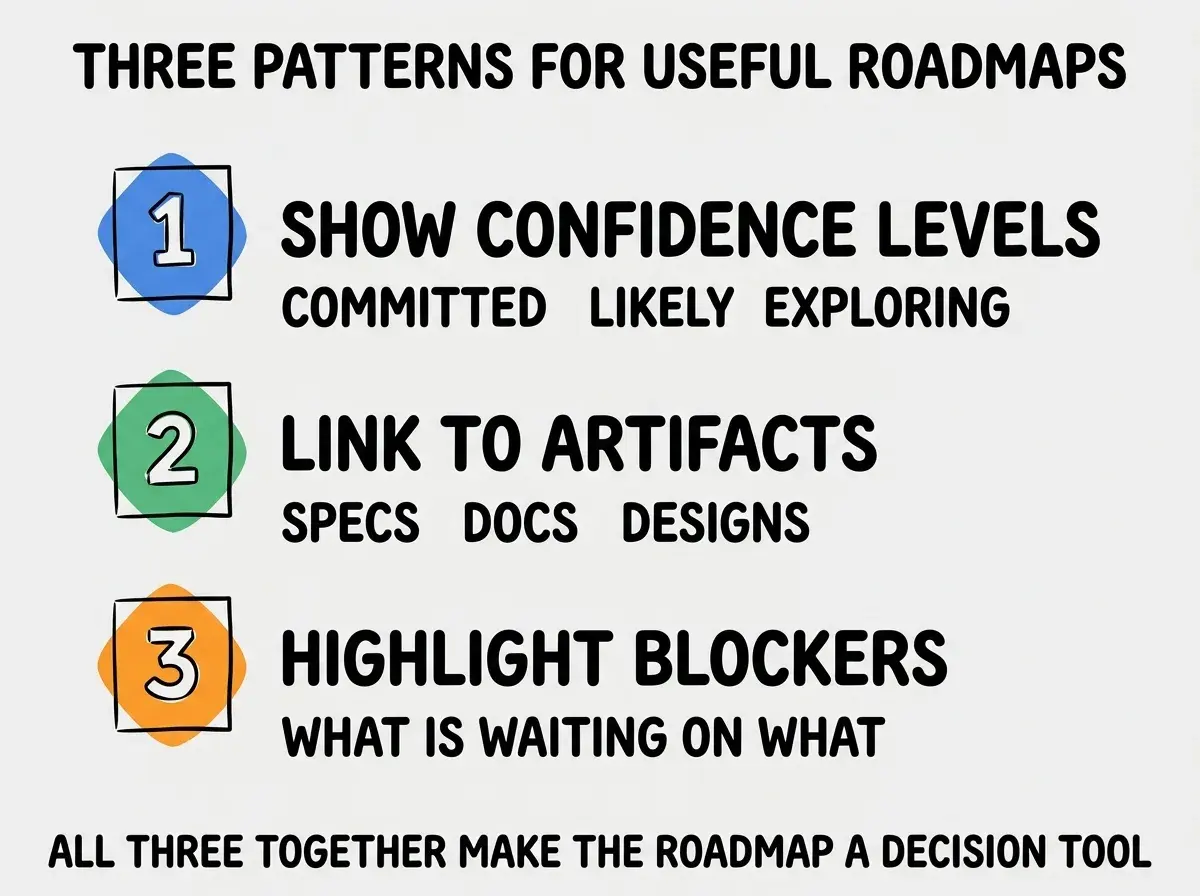
Pattern 1, show confidence levels. Every roadmap item has a confidence (committed, likely, exploring). Tells stakeholders what is actually firm vs aspirational.
Pattern 2, link to artifacts. Each item links to its spec, design, and discussion. Makes the roadmap a hub rather than a dead end.
Pattern 3, highlight blockers. Visual indicators for items that are waiting on something. Makes dependencies obvious and actionable.
The "show confidence levels" pattern is the most underrated because it changes how stakeholders consume the roadmap. A roadmap with everything shown as committed creates expectations the team cannot meet; a roadmap that distinguishes committed from likely from exploring sets honest expectations and builds trust. Stakeholders learn to read the confidence labels and adjust their planning accordingly. Over time, this transparency reduces the friction in every roadmap conversation because everyone is working from the same understanding of what is real vs aspirational.
The "link to artifacts" pattern matters because it eliminates a common roadmap failure: stakeholders see an item, want more context, and have to ask the PM. When every item links to its spec, design, and discussion, stakeholders self-serve. The PM stops being a bottleneck for context; the roadmap becomes a hub for the work rather than a summary of it.
Implementation Tips
The build itself is straightforward with AI assistance. A few choices significantly affect the outcome.
Tip 1, start with one issue tracker. Build the integration for whichever tracker your team uses first (Linear, Jira, or GitHub Issues). Adding more later is straightforward; trying to support all three from day one slows down the initial build.
Tip 2, use webhooks plus periodic sync. Webhooks give real-time updates; periodic sync (every hour) catches anything webhooks missed. Together they ensure the roadmap stays current without missing edge cases.
Tip 3, render server-side. Server-side rendering means the roadmap loads quickly for stakeholders even on slow connections. Charting libraries that support SSR (recharts, Visx) work well; D3 requires more care to render server-side.
Tip 4, cache aggressively. The roadmap data does not change every second. Cache the rendered views for 5 minutes; the freshness loss is negligible and the performance gain is substantial.
Tip 5, instrument everything. Track which views get used most, which items get clicked, which links get followed. The usage data informs which patterns to invest in next. A roadmap nobody clicks on is not driving decisions; the data tells you whether your tool is working.
The combination of these tips produces a roadmap visualizer that ships in two days and stays useful for months. The investment is small compared to the cumulative value of having a roadmap stakeholders trust.
The most damaging roadmap mistake is publishing it as a static document (slides, PDF, or printed wall chart). Static roadmaps go stale within days as priorities shift. The fix is to publish the roadmap as a live URL that anyone can check, with the auto-refresh ensuring it always reflects the current state. Stakeholders quickly learn that the URL is the source of truth and stop asking "is this still accurate" because it always is.
The other mistake is showing too long a horizon. Roadmaps with 12+ month items tend to be wrong about the back half because the world changes. Show 1-3 months in detail, 3-6 months as themes, and 6+ months as broad direction. The compressed horizon is honest and easier to maintain.
PMs sometimes resist the compressed horizon because executives ask for "the 12-month plan" and showing only 6 months feels like a failure to deliver. The right framing is that a 12-month plan with low-confidence items in the back half is misleading; a 6-month plan with high-confidence items is honest. Most experienced executives prefer the honest version once they understand the tradeoff. The roadmap visualization tool can support both by showing confidence-weighted detail (high-confidence items get full cards; lower-confidence items get smaller theme labels). The visual hierarchy communicates honesty without requiring stakeholders to read the small print.
What This Means For You
A custom roadmap visualizer is one of the highest-leverage PM investments in 2026. The build is small, the maintenance burden is low, and the stakeholder communication value compounds across every product decision.
- If you're a founder: Build this for your team if you currently maintain a manual roadmap. The time savings alone justify the build.
- If you're changing careers into PM: Roadmap visualization is a great portfolio piece that combines PM judgment with modern tooling.
- If you're a student: Build one for your own projects to practice the data integration patterns. The skills transfer to any data visualization work.
Browse more PM build guides
Read more build articles