A product manager building a competitive analysis dashboard tracks competitors systematically rather than reactively. Four feature areas matter: competitor profile management, feature comparison matrix, pricing tracking over time, and news and update monitoring. The build takes a weekend with vibe coding tools and produces a dashboard tailored to your competitive intelligence needs. PMs with systematic competitive intelligence make better strategic decisions than PMs operating on impression.
This tutorial walks through the four feature areas, the prompts that build each, what makes dashboards useful for strategy, and the four mistakes PMs make building competitive intelligence.
Why PM Built Competitive Dashboards Matter
PM built competitive dashboards matter because commercial competitive intelligence tools are expensive and rarely fit specific PM needs. Custom dashboards fit decision making style.
The 2026 reality is that vibe coding tools enable PMs to build competitive intelligence systems. Build capability removes commercial tool dependency.
A 2025 product strategy survey of 200 PMs found that PMs with systematic competitive intelligence systems made strategic decisions 3.4x faster than PMs operating on impression. Systematic intelligence measurably accelerates strategic decisions.
The pattern to copy is the way intelligence agencies maintain country profiles. Profiles updated continuously; analysts reference profiles for decisions. Competitive analysis follows similar logic; profiles enable decisions.
The Four Feature Areas
Four feature areas form complete competitive analysis dashboard.
Feature 1, competitor profile management. Each competitor has profile with company info, products, pricing, positioning.
Feature 2, feature comparison matrix. Side by side feature comparison; reveals gaps and advantages.
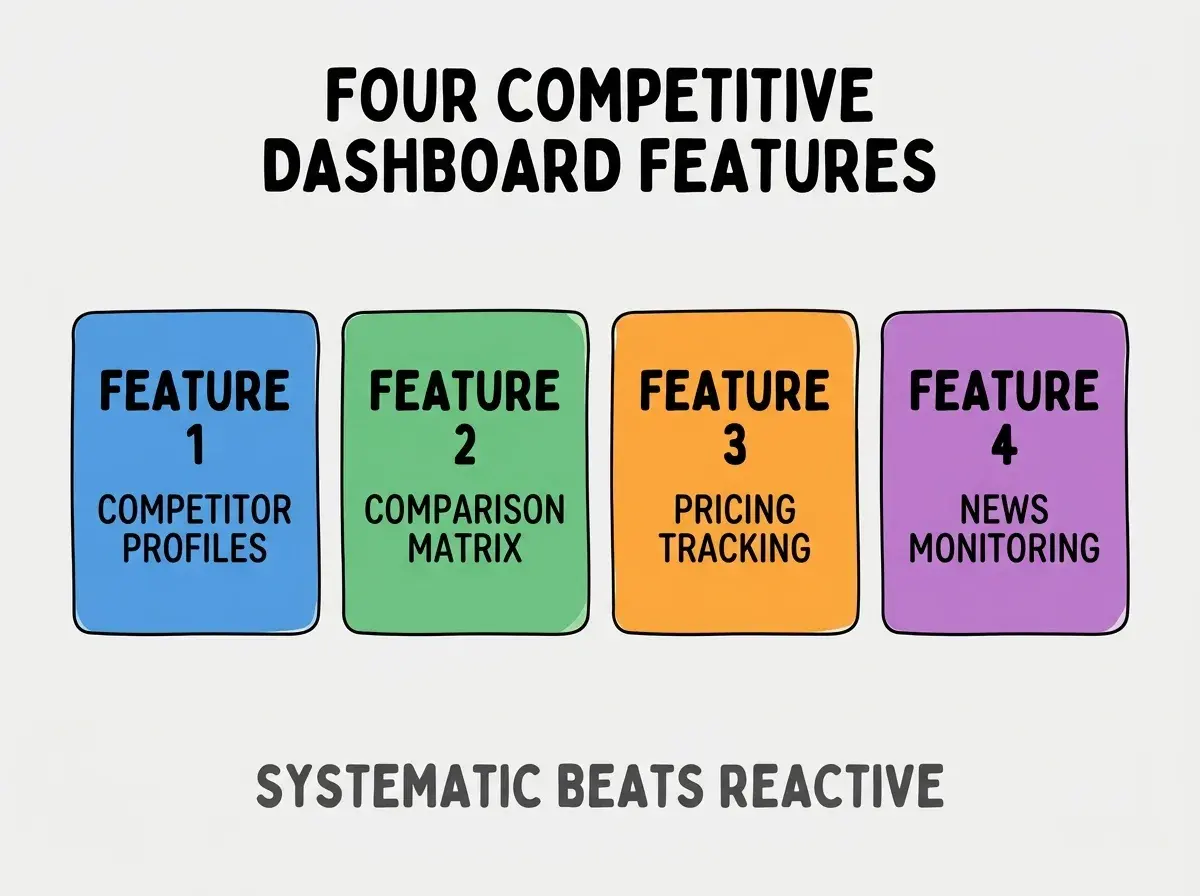
Feature 3, pricing tracking over time. Competitor prices tracked historically; trends inform pricing decisions.
Feature 4, news and update monitoring. Competitor news, product launches, hiring all tracked; signals inform strategy.
The Prompts That Build Each Feature
Four prompts implement each feature.
Prompt 1, build competitor profiles. "Create competitor table with name, website, founded year, employees, funding, target market, key products. CRUD interface for adding and editing."
Browse more build articles
Read more buildPrompt 2, add feature comparison matrix. "Build matrix view with competitors as columns, features as rows. Each cell shows whether competitor has feature with notes. Filter by feature category."
Prompt 3, build pricing tracking. "Create pricing table per competitor with date entries. Time series chart shows price changes. Alert when competitor changes price."
Prompt 4, add news monitoring. "RSS feed integration for competitor blogs and news. AI summarizes new content; summaries appear in dashboard daily."
What Makes Competitive Dashboards Useful
Three patterns separate useful competitive dashboards from data collection exercises.
Pattern 1, focus on decisions not data. Tracking should inform decisions; data without decisions wastes effort.
Pattern 2, regular review cadence. Weekly or biweekly review prevents decay; cadence builds habit.
Pattern 3, share with team strategically. Selective sharing produces alignment; oversharing produces noise.
What Makes Competitive Intelligence Sustainable
Three patterns separate sustainable intelligence from one off projects.
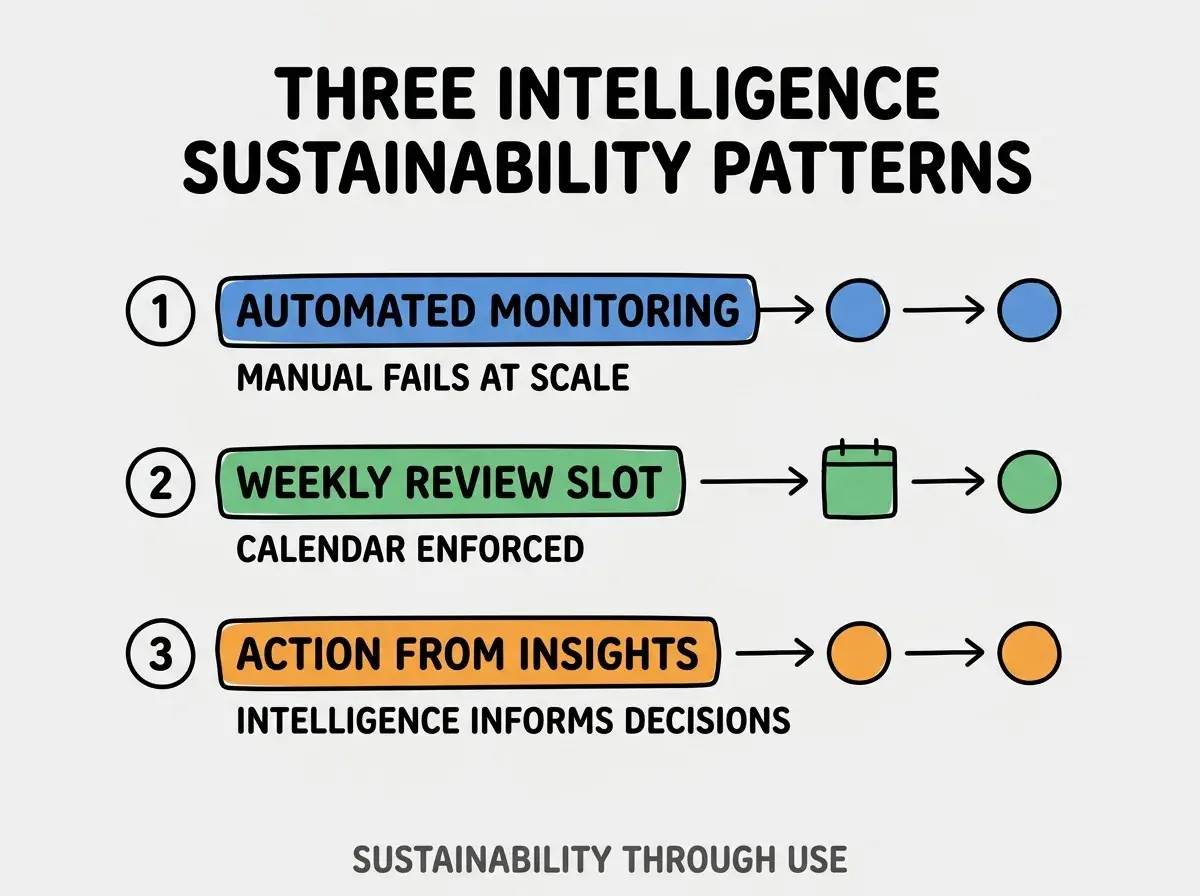
Pattern 1, automated monitoring where possible. Manual fails at scale; automation enables coverage.
Pattern 2, weekly review slot on calendar. Calendar enforcement builds habit; without slot, review skips.
Pattern 3, action from insights expected. Insights without action produce no value; action required.
The combination produces sustainable competitive intelligence. Without these patterns, intelligence decays.
How To Source Competitive Intelligence
Three patterns produce competitive intelligence sources.
Pattern A, public sources first. Websites, social media, press releases all public. Public sources usually sufficient for tactical decisions.
Pattern B, customer interviews for context. Customers reveal competitor positioning; positioning informs strategy.
Pattern C, win/loss analysis with sales. Sales conversations reveal competitive dynamics; dynamics inform product decisions.
Common Questions About Competitive Dashboards
Competitive dashboards raise questions worth addressing directly.
The first question is whether to use commercial tools or build custom. Commercial for specialized intelligence; custom for PM specific needs. Both have place.
The second question is how many competitors to track. 5-10 main competitors deeply; broader awareness of secondary. Depth over breadth.
The third question is whether to share dashboards publicly. No; competitive intelligence internal. Sharing reveals strategy.
The fourth question is how to handle confidential intelligence sources. Document sources separately from public dashboard; protect sources.
How Competitive Intelligence Affects Strategy
Competitive intelligence affects strategy in compounding ways. Strategy effects compound across product roadmap.
The first compounding effect is positioning clarity. Knowing competitors enables differentiating positioning; positioning compounds market share.
The second compounding effect is feature prioritization. Competitive gaps inform priorities; priorities affect roadmap.
The third compounding effect is pricing power. Competitive pricing knowledge enables informed pricing; pricing affects revenue.
The combination produces strategy shaped by intelligence. Without intelligence, strategy follows guess.
How To Use AI For Competitive Analysis
Three patterns help AI assist competitive analysis.
Pattern A, AI summarizes competitor content. Blog posts, documentation, press releases all summarized; summaries enable scanning.
Pattern B, AI extracts feature lists from product pages. Feature extraction from competitor websites; extraction populates comparison matrix.
Pattern C, AI sentiment analysis on competitor reviews. Review sentiment reveals competitor weakness; weakness informs positioning.
The combination produces AI assisted competitive analysis. Without AI assistance, analysis hits manual limits.
The most damaging competitive analysis mistake is collecting data without informing decisions. Data collection produces dashboards full of information that does not change anything. The fix is to start with decisions then build dashboards backward; what decisions need competitive support, what data informs decisions. Decision focused dashboards produce strategic value; data focused dashboards produce reports that nobody acts on.
The other mistake is too many competitors tracked. Tracking 50 competitors prevents depth; constraint to 5-10 enables depth.
A third mistake is missing the customer perspective. Competitive intelligence without customer context misses what matters.
A fourth mistake is treating competitive analysis as one off exercise. Competition evolves; intelligence requires ongoing attention.
What This Means For You
PM built competitive analysis dashboards enable systematic strategic decision making. The four features, prompts, and intelligence patterns produce dashboards that compound strategic advantage.
- If you're a product manager: Build a basic competitive dashboard this weekend; systematic intelligence beats reactive competitive watching.
Browse more build articles
Read more build