Are you actually faster with AI? Most builders feel faster but the METR study found measured productivity often differs from perceived productivity. The four metrics that reveal real AI productivity are time from idea to shipped, percentage of code merged vs reverted, bugs caught in production vs prevented, and total iterations per shipped feature. Tracking these four metrics for 4 weeks reveals whether your perceived speed matches your measured speed.
This checklist walks through the four metrics, how to track each, what numbers indicate problems, and the four mistakes builders make when measuring AI productivity.
Why Measuring AI Productivity Matters
Measuring AI productivity matters because perception and measurement diverge significantly. The METR study showed 43 percentage point gap between perception and reality for some developers; gap means decisions based on perception lead astray.
The 2026 reality is that AI productivity claims dominate discourse without measurement backing. Personal measurement reveals what your specific situation actually produces.
A 2025 productivity tracking study of 200 vibe coders who measured productivity for 4 weeks found that 38 percent discovered they were slower with AI than estimated, 27 percent matched estimate, and 35 percent were faster than estimated. Measurement reveals truth that perception obscures.
The pattern to copy is the way investors track returns rather than estimating them. Estimated returns and actual returns diverge dramatically; serious investors measure. Coding productivity follows same pattern; serious developers measure.
The Four Productivity Metrics
Four metrics reveal real AI productivity.
Metric 1, time from idea to shipped. End to end time from feature decision to feature in production.
Metric 2, percentage of code merged vs reverted. Generated code that ships vs generated code that gets thrown away.
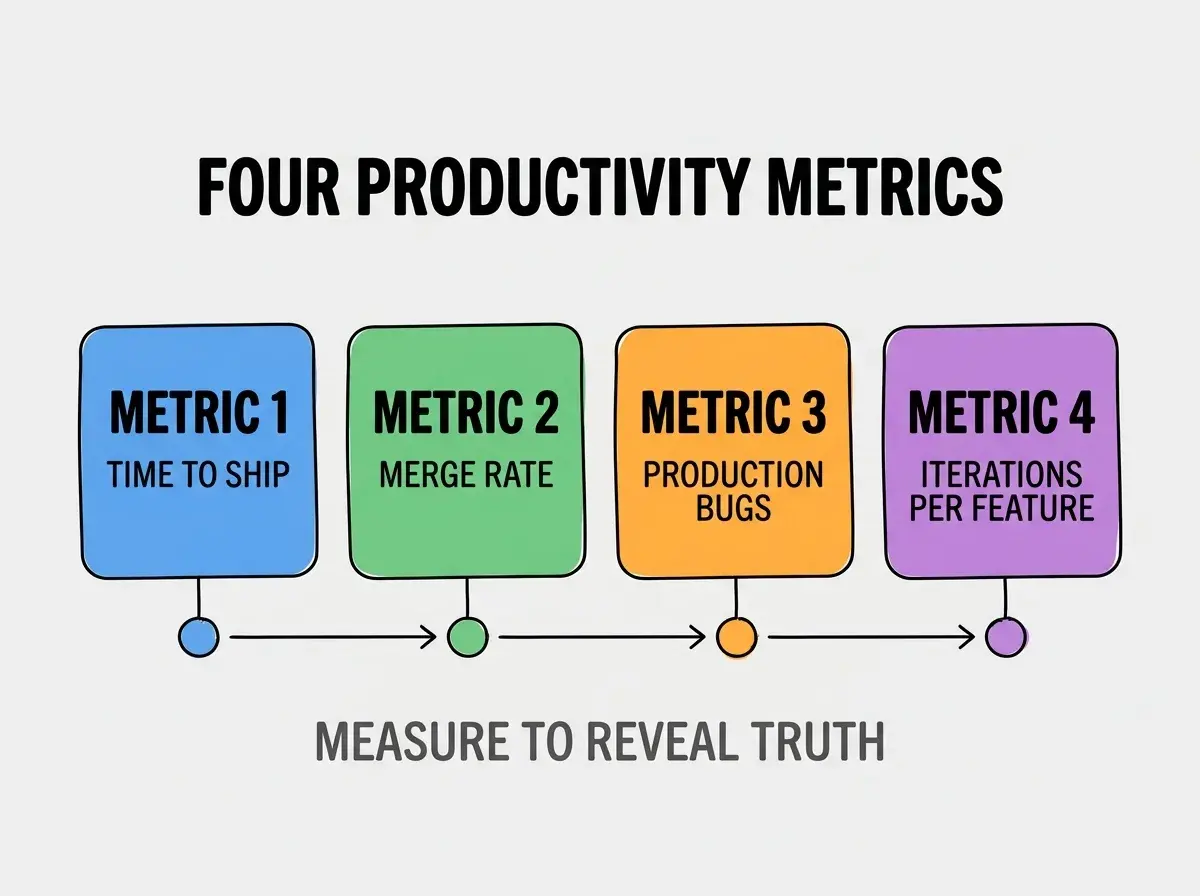
Metric 3, bugs caught in production vs prevented. Bugs reaching production indicate quality issues that offset speed.
Metric 4, total iterations per shipped feature. Number of AI generation cycles to reach shipped feature.
How To Track Each Metric
Four tracking approaches make measurement practical.
Tracking 1, ticket timestamps for time to ship. Track ticket created date and shipped date; difference is time to ship.
Browse more foundations
Read more foundationsTracking 2, git stats for merge vs revert. Count commits merged vs commits reverted in given period.
Tracking 3, error tracker for production bugs. Sentry or similar tracks production bugs; bugs per ship measure quality.
Tracking 4, personal log for iterations. Note AI iterations per feature in personal log; manual tracking suffices.
What Numbers Indicate Problems
Four warning patterns reveal AI productivity issues.
Warning 1, time to ship not improving over time. AI tool experience should compound; flat time signals stagnation.
Warning 2, revert rate above 30 percent. Generated code reverted often means generation is wrong; quality issue.
Warning 3, production bugs above pre AI baseline. AI introducing more bugs than previous workflow is concerning signal.
Warning 4, iterations above 5 per feature. Many iterations signal prompting or planning issues.
What Makes Productivity Measurement Sustainable
Three patterns separate sustainable measurement from temporary tracking.
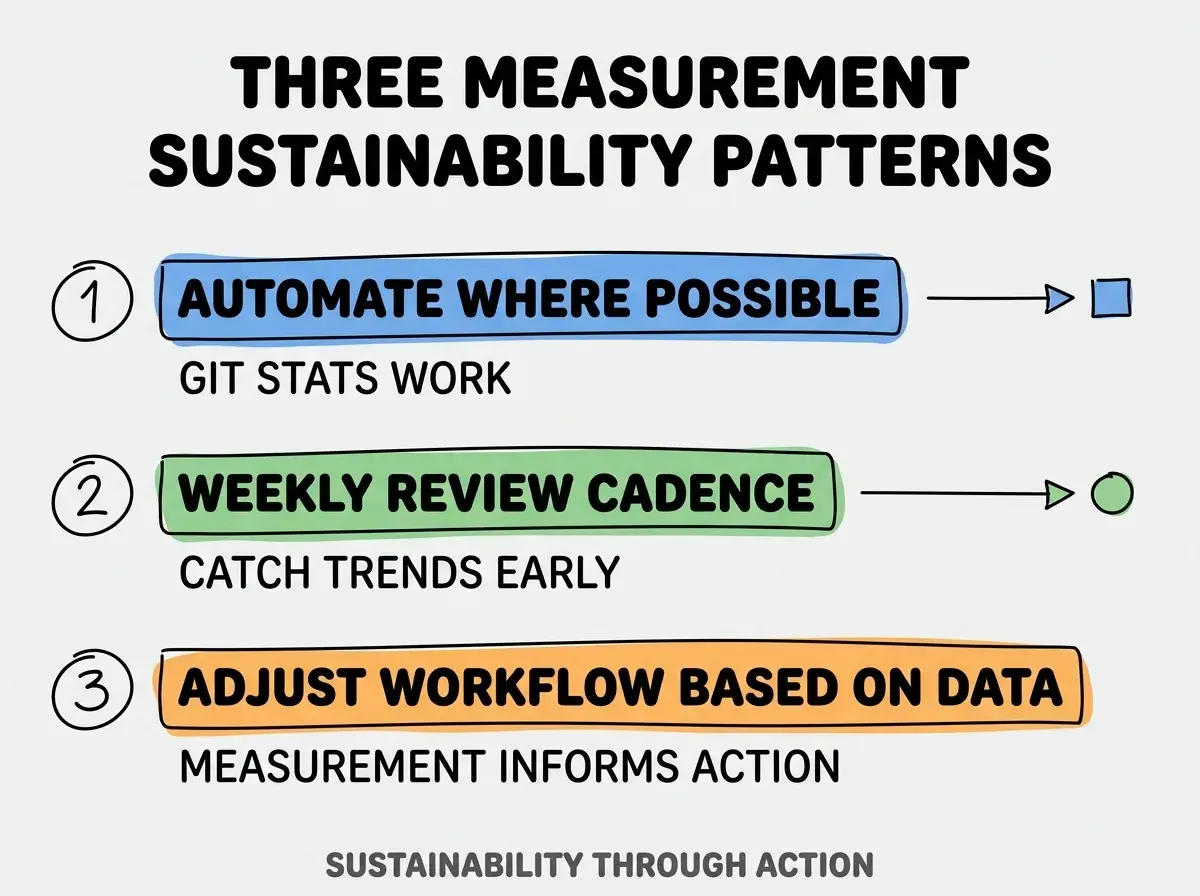
Pattern 1, automate where possible. Git stats and ticket timestamps automate; manual tracking only where automation impossible.
Pattern 2, weekly review cadence. Weekly review catches trends; less frequent misses gradual changes.
Pattern 3, adjust workflow based on data. Measurement without workflow change produces no improvement; data must inform action.
The combination produces sustainable measurement. Without these patterns, measurement becomes ceremony.
How To Establish Productivity Baseline
Three baseline patterns enable comparison.
Pattern A, measure 4 weeks before workflow change. Pre change baseline enables measuring change effect.
Pattern B, isolate variables when possible. Same project, same complexity for baseline vs change measurement.
Pattern C, accept noise in measurement. Productivity varies week to week; trends matter more than single weeks.
Common Questions About Productivity Measurement
AI productivity measurement raises questions worth addressing directly.
The first question is whether to share productivity data with team. Solo measurement first; team sharing adds dynamics that affect what gets measured.
The second question is whether AI tool changes invalidate baseline. Yes; tool changes require new baseline. Track tool change dates.
The third question is whether feeling productive matters even if measurement says otherwise. Job satisfaction matters; pure measurement misses motivation factors.
The fourth question is how to measure for tasks that vary widely. Track tasks with similar shape; cross task comparison fails.
How Measurement Affects Career Decisions
Productivity measurement affects career decisions in compounding ways. Career effects compound across decades.
The first compounding effect is workflow optimization. Measurement reveals what works; optimization compounds.
The second compounding effect is tool selection clarity. Data based tool decisions outperform fashion based decisions.
The third compounding effect is hiring negotiations. Measured productivity backs salary discussions; data strengthens position.
The combination produces career trajectories shaped by measurement habit. Without measurement, career decisions follow assumption.
How To Improve When Measurement Reveals Issues
Three improvement patterns address common measurement findings.
Pattern A, time to ship slow because review takes long. Improve review patterns; consider AI assisted review.
Pattern B, revert rate high because prompts unclear. Improve prompting; spend more time on prompt construction.
Pattern C, production bugs high because testing missed. Add tests; AI generated code needs tests like human code.
The combination produces improvement based on measurement. Without measurement, improvement follows assumption rather than evidence.
The most damaging productivity measurement mistake is measuring activity rather than outcomes. Lines of code, commits made, hours worked all measure activity. Time to ship, features delivered, bugs prevented measure outcomes. The fix is to measure outcomes that users experience; outcomes correlate with value, activity does not. Builders who measure outcomes optimize what matters; builders who measure activity optimize incentives that produce no value.
The other mistake is treating measurement as judgment of self worth. Measurement reveals workflow; workflow can change. Self worth not at stake.
A third mistake is over measuring. 4 metrics are enough; tracking 20 metrics produces noise without signal.
A fourth mistake is missing the comparison baseline. Without baseline, measurement reveals current state but not change direction.
What This Means For You
Measuring real AI productivity reveals whether perception matches reality. The four metrics, tracking approaches, and improvement patterns produce honest productivity awareness that compounds across career.
- If you're a senior dev: Measure productivity for 4 weeks; data may surprise you in either direction.
- If you're an indie hacker: Productivity directly affects business velocity; measurement informs workflow investments.
Browse more foundations
Read more foundations