Table design with sorting, filtering, and pagination done right makes data accessible without overwhelming users. Four core features matter: sortable columns (click header to sort), filterable rows (search and filter UI), paginated results (page through large datasets), and selectable rows (bulk actions). Combined features make tables productive; missing any limits user capability. Vibe coded apps with data benefit from tables done right; defaults often miss key features.
This tutorial walks through the four features, the implementation patterns, what makes tables usable, and the four mistakes builders make on table design.
Why Table Design Matters
Table design matters because data heavy apps live in tables; bad tables limit user productivity. Without good tables, data inaccessible.
The 2026 reality is that table libraries (TanStack Table, AG Grid) make implementation accessible. Maturation removed implementation barrier.
A 2025 product UX study of 400 vibe coded data apps found that apps with comprehensive table features (sort, filter, page, select) achieved 51 percent better user task completion than apps with basic tables, primarily through enabling user data exploration. Tables measurably affect productivity.
The pattern to copy is the way Excel succeeded as data tool. Sort, filter, organize all built in; users explore data freely. Tables in apps benefit from same capabilities; users explore data.
The Four Core Features
Four features form complete table.
Feature 1, sortable columns. Click header to sort. Discovery.
Feature 2, filterable rows. Search and filter. Reduction.
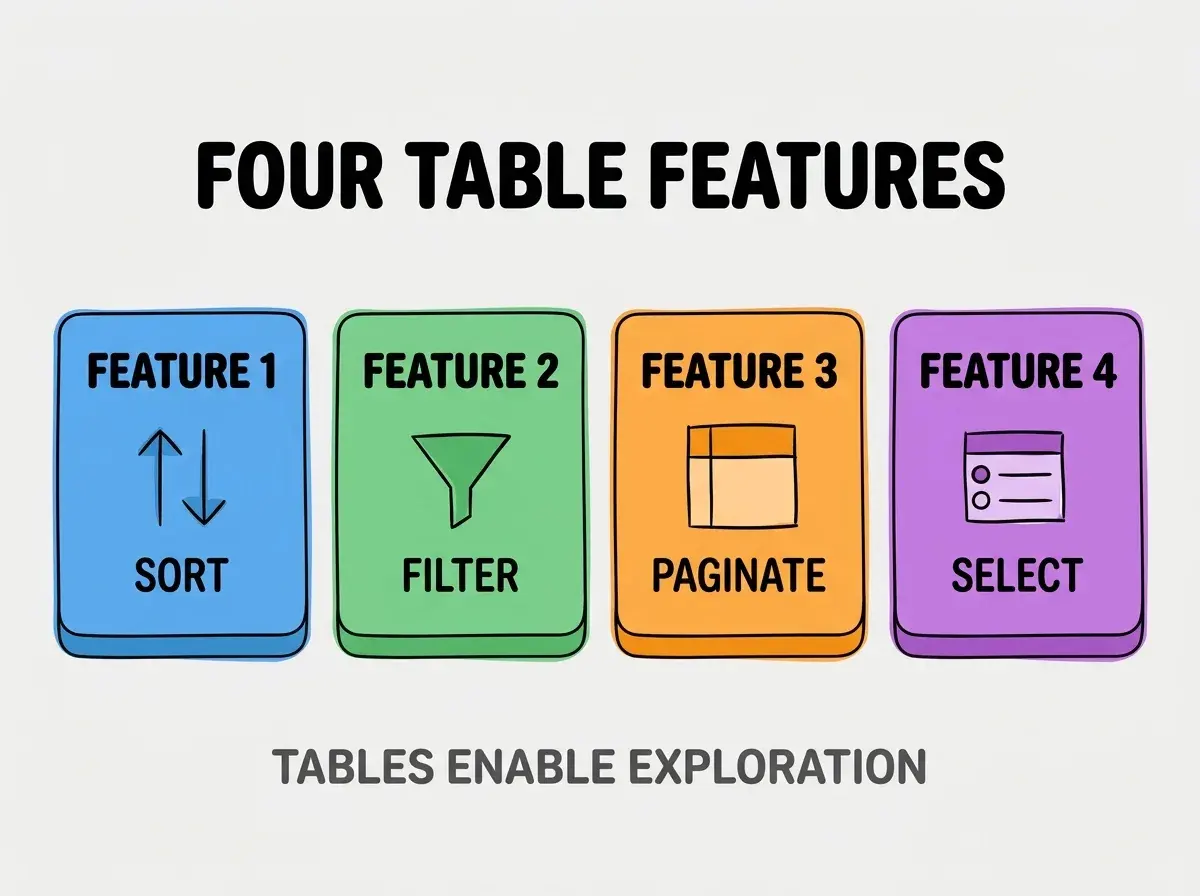
Feature 3, paginated results. Page through large data. Performance.
Feature 4, selectable rows. Bulk actions. Power user.
How To Implement Each Feature
Four implementation patterns address each feature.
Implementation 1, TanStack Table for sorting. Headless library; flexible.
Browse more build
Read more buildImplementation 2, server side filtering for large data. Server filters scale better.
Implementation 3, cursor pagination for performance. Cursor better than offset at scale.
Implementation 4, checkbox per row plus header. Standard selection pattern.
What Makes Tables Usable
Three patterns separate usable tables from frustrating.
Pattern 1, fast sort. Slow sort frustrates; fast maintains flow.
Pattern 2, clear filter state. What's filtered visible.
Pattern 3, predictable pagination. Page state predictable.
What Makes Table Strategy Sustainable
Three patterns separate sustainable strategy from constant rewrites.
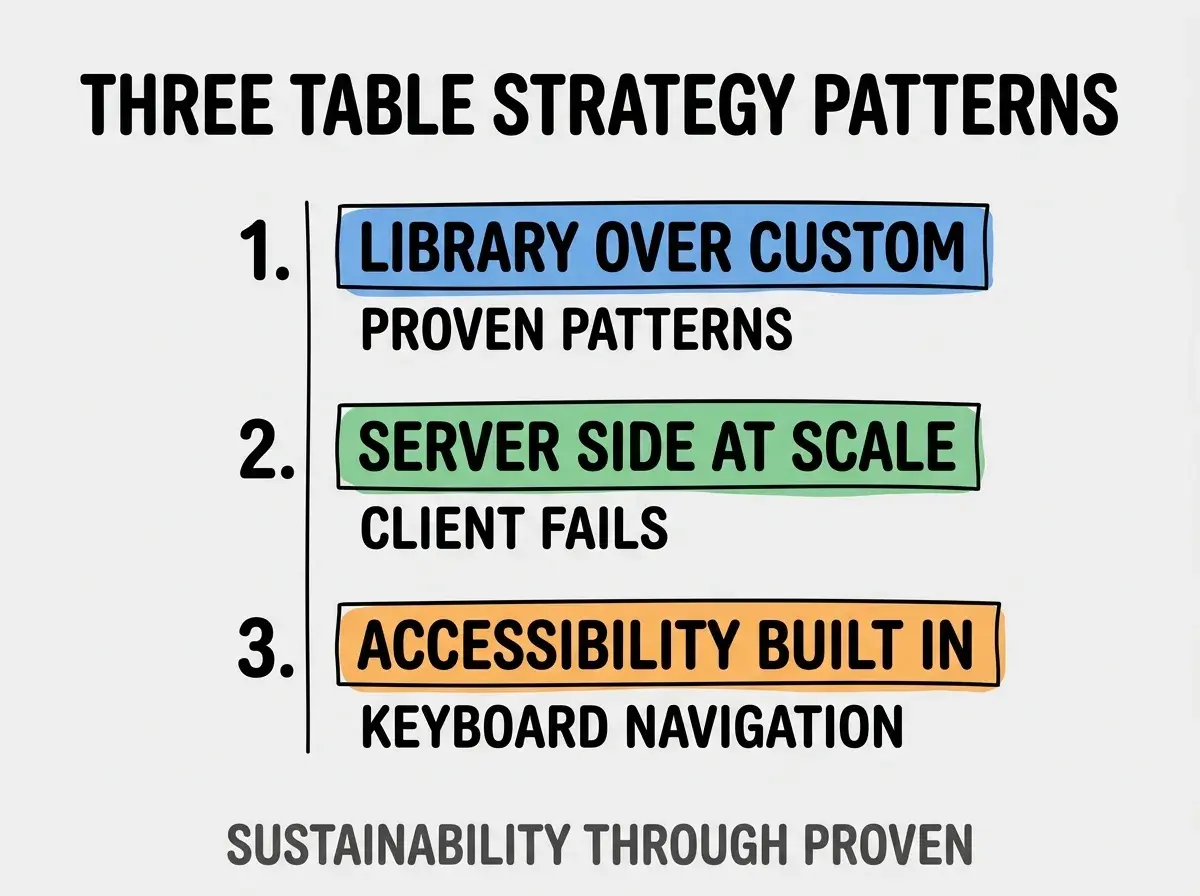
Pattern 1, library over custom. Proven patterns; custom rebuilds.
Pattern 2, server side at scale. Client fails at large data.
Pattern 3, accessibility built in. Keyboard navigation; standard.
The combination produces sustainable tables. Without these patterns, tables become burden.
How To Choose Table Library
Three patterns help library choice.
Pattern A, TanStack Table for flexibility. Headless; total control.
Pattern B, AG Grid for enterprise. Feature rich; complex.
Pattern C, Material Table for simple. Pre styled; quick.
Common Questions About Tables
Tables raise questions worth addressing directly.
The first question is when to use cards vs tables. Tables for comparison; cards for browsing.
The second question is whether to support virtual scrolling. Yes for thousands of rows.
The third question is what about mobile. Mobile tables hard; consider cards.
The fourth question is whether to allow column reordering. Yes for power users.
How Tables Affect Data Exploration
Tables affect data exploration in compounding ways. Exploration effects compound across users.
The first compounding effect is task completion. Better tables better completion.
The second compounding effect is data insights. Exploration reveals insights; insights inform decisions.
The third compounding effect is power user adoption. Power users live in tables; tables retain.
The combination produces exploration shaped by table quality. Without quality, exploration limited.
How To Handle Large Datasets
Three patterns help large datasets.
Pattern A, virtual scrolling. Render only visible rows; performance.
Pattern B, server side everything. Sort, filter, paginate server side.
Pattern C, progressive disclosure. Less data first; more on demand.
The combination produces large dataset tables. Without patterns, tables crash.
The most damaging table mistake is implementing all features client side at scale. Client crashes with thousands of rows; users frustrated. The fix is to move sort, filter, paginate server side at scale; client handles only display. Builders who scale server side maintain performance; builders who keep client side ship apps that crash with real data.
The other mistake is missing the keyboard navigation. Tables need keyboard for power users.
A third mistake is over engineering features. Start basic; add as user needs reveal.
A fourth mistake is treating tables as one off. Tables evolve with data; ongoing iteration.
What This Means For You
Table design with sorting, filtering, and pagination done right enables user productivity for data heavy apps. The four features, implementation patterns, and sustainability approaches produce tables that compound user value.
- If you're a senior dev: Table fluency expected for data apps; learn patterns deeply.
- If you're a product manager: Table design affects user productivity; design matters.
- If you're changing careers: Data UI fluency valuable; specialty differentiates.
Browse more build
Read more build