The satisfaction paradox is the 2026 phenomenon where AI coding tool usage continues climbing (now 92 percent of developers) while satisfaction with those same tools is falling (down 14 points year over year). Four paradox patterns explain this gap, the underlying causes are now better understood, and the implications shape how organizations should think about AI tool adoption. The paradox is not a measurement error; it is a real signal worth understanding.
This piece walks through the four paradox patterns, what causes the gap, what the paradox reveals about AI tools, and the four mistakes when interpreting satisfaction data.
Why The Satisfaction Paradox Matters
The satisfaction paradox matters because it challenges the simple "AI tools are great" narrative. Reality is more nuanced; nuance affects strategy.
The 2026 reality is that the paradox is well documented across multiple surveys. Stack Overflow, JetBrains, and GitHub data all show similar patterns. Pattern persistence increases analytical confidence.
The 2026 Stack Overflow Developer Survey of 90,000 developers found that 92 percent regularly use AI coding tools (up from 76 percent in 2024) while satisfaction with those tools fell from 70 percent to 56 percent over the same period. The 16 point satisfaction drop while usage grew 16 points is the satisfaction paradox in numbers.
The pattern to copy is the way economists analyze paradoxical trends like rising productivity with falling wages. Apparent contradictions usually have explanations; explanations matter for policy.
The Four Paradox Patterns
Four patterns characterize the satisfaction paradox.
Pattern 1, mandatory adoption depressing satisfaction. Developers who used AI by choice in 2023 reported high satisfaction; mandated AI adoption in 2026 includes reluctant users.
Pattern 2, expectation inflation outpacing capability growth. Marketing promises grew faster than tool capability; gap produces disappointment.
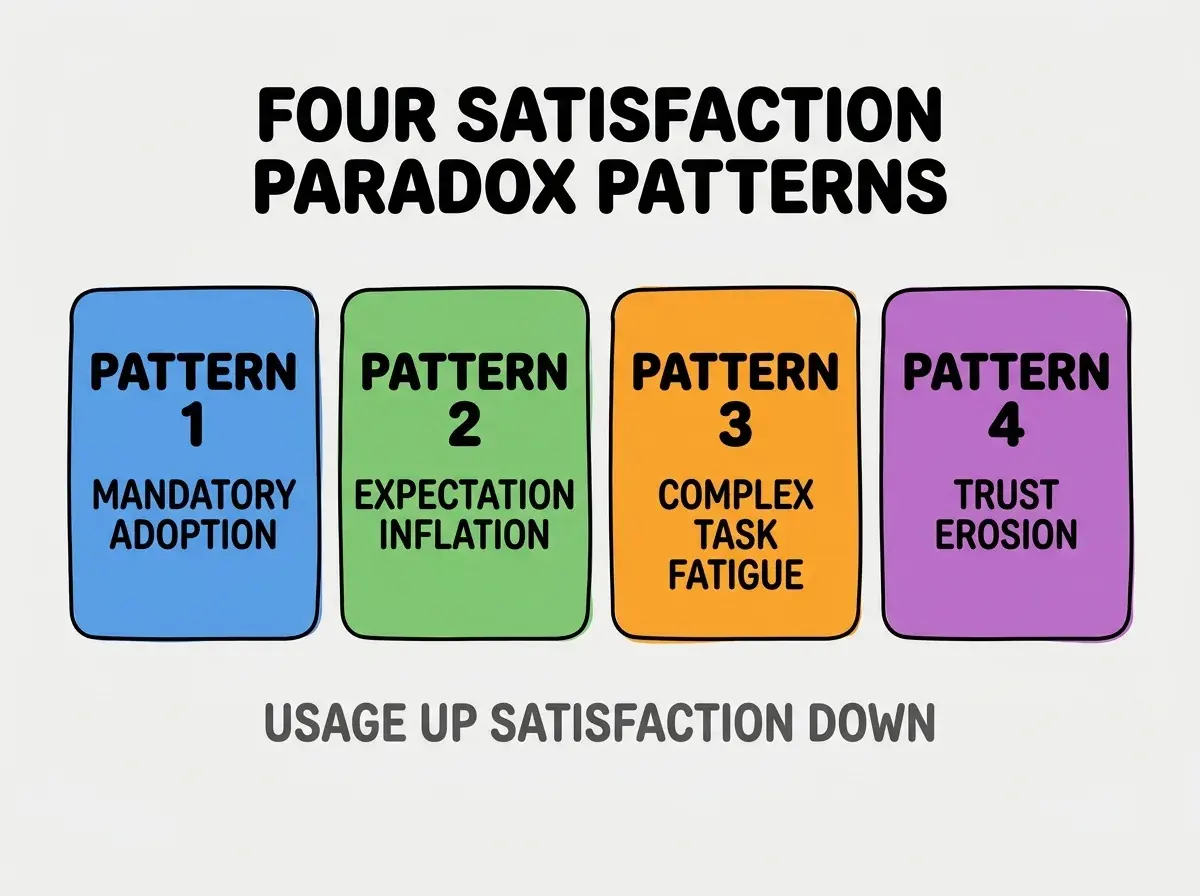
Pattern 3, complex task fatigue. AI excels at simple tasks; struggles with complex ones. Users handling complex work experience more frustration.
Pattern 4, trust erosion from accumulated bad experiences. Each AI hallucination or wrong fix erodes trust; trust accumulates negatively across users.
What Causes The Gap
Three causes drive satisfaction paradox patterns.
Cause 1, usage measures behavior, satisfaction measures perception. Behavior persists when alternatives are worse; perception responds to specific experiences. The metrics measure different things.
Browse more pulse
Read more pulseCause 2, network effects pull usage up. When everyone uses AI, opting out has cost. Usage rises from network pressure; satisfaction does not benefit from network pressure.
Cause 3, task complexity selection bias. AI handles easy tasks; humans get the hard ones. Hard task experience drives satisfaction down even as easy task offloading drives usage up.
The combination explains the paradox. Multiple causes mean multiple intervention points exist.
What The Paradox Reveals About AI Tools
Three insights emerge from satisfaction paradox analysis.
Insight 1, capability gaps remain real despite progress. Tools have improved dramatically; capability gaps still produce daily friction. Improvement is not completion.
Insight 2, adoption metrics oversell tool quality. High adoption is reported as success; satisfaction tells more nuanced story. Adoption alone is not quality measure.
Insight 3, developer experience design matters more as adoption matures. Early adopters tolerate friction; mainstream users do not. Mature adoption requires better experience.
The combination informs better tool design and adoption strategy. Without these insights, both vendors and adopters miss the dynamics shaping the market.
What Makes Satisfaction Improvement Sustainable
Three patterns separate sustainable satisfaction improvement from temporary fixes.
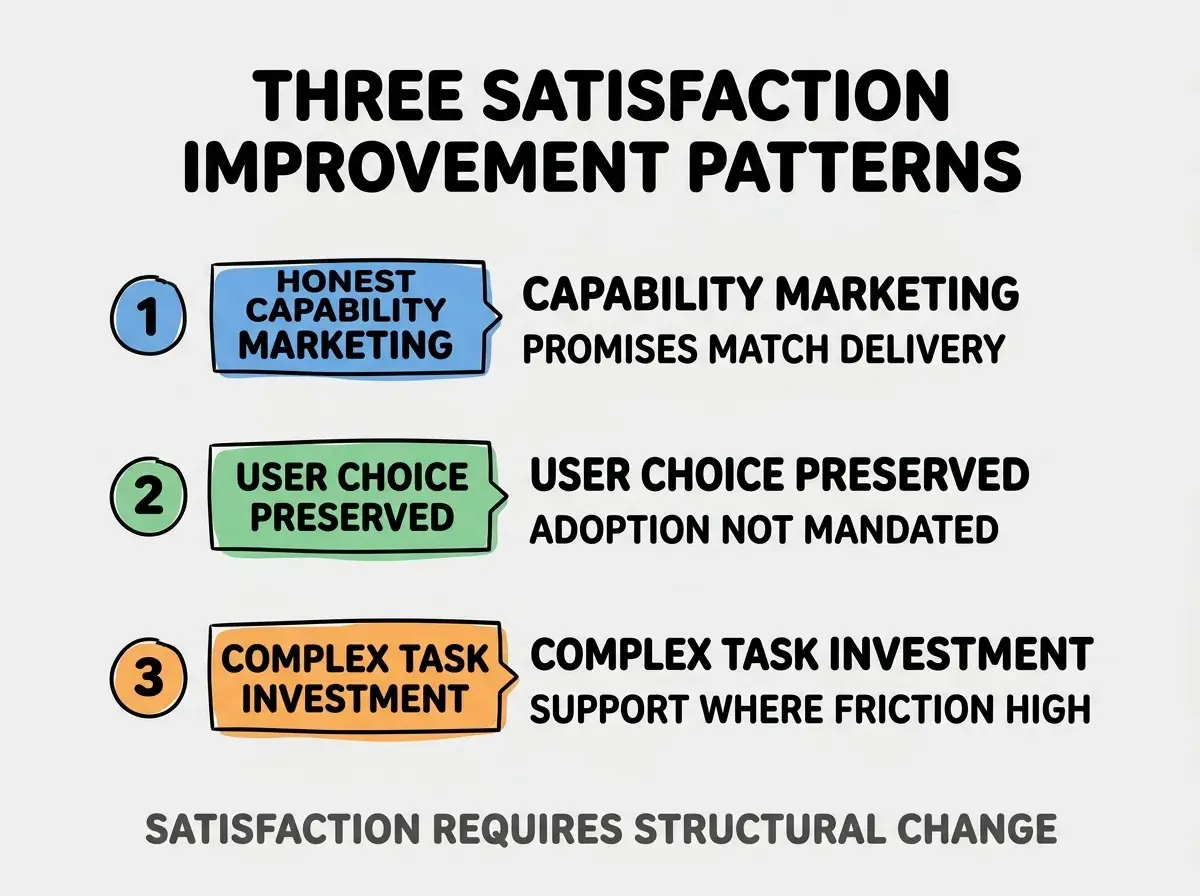
Pattern 1, honest capability marketing. Promises matched to delivery; gap reduction comes from honesty.
Pattern 2, user choice preservation in adoption. Choice driven users report higher satisfaction; mandated users report lower. Choice matters.
Pattern 3, complex task support investment. Where users hit friction, investment reduces friction. Sustained investment produces sustained satisfaction.
The combination produces sustainable satisfaction improvement. Without these patterns, satisfaction improvements are temporary.
How To Use Satisfaction Data Strategically
Three application patterns help strategic use of satisfaction paradox data.
Application 1, evaluate vendors on satisfaction trends. Vendors with rising satisfaction outperform vendors with falling satisfaction; trend matters more than absolute level.
Application 2, design adoption programs for satisfaction. Mandated adoption may hit usage targets while damaging satisfaction; design for both.
Application 3, segment satisfaction by task complexity. Simple task satisfaction differs from complex task satisfaction; segmentation reveals where investment matters.
The combination produces strategic decisions informed by satisfaction nuance. Without nuanced data, strategy follows aggregate metrics that hide important patterns.
Common Questions About The Satisfaction Paradox
The satisfaction paradox raises questions worth addressing directly.
The first question is whether the paradox will resolve as tools improve. Likely partially; tool improvement helps but does not address adoption mandate or expectation inflation.
The second question is whether satisfaction matters if usage continues. For vendors, eventually yes; satisfied users churn less and refer more. For users, immediately yes.
The third question is whether the paradox is unique to AI coding tools. No; similar paradoxes appear in other categories. Pattern is general but particularly visible in AI coding.
The fourth question is whether to slow AI adoption to preserve satisfaction. Adoption mandates produce competitive pressure; slowing requires accepting competitive cost.
How The Paradox Affects Industry Decisions
The satisfaction paradox affects industry decisions in compounding ways. Decision effects compound across years.
The first compounding effect is vendor strategy. Vendors who address satisfaction differentiate; vendors who only chase adoption commoditize.
The second compounding effect is buyer evaluation. Sophisticated buyers add satisfaction to evaluation criteria; basic buyers track adoption only. Sophistication affects tool quality outcomes.
The third compounding effect is regulation interest. Falling satisfaction in mandated adoption attracts regulatory attention; regulation shapes industry constraints.
The combination produces industry dynamics that shape tool markets. Without paradox awareness, organizations miss the dynamics.
How To Improve Personal Satisfaction With AI Tools
Three patterns help individual developers improve AI tool satisfaction.
Pattern A, calibrate expectations to capability. Match tool use to tool strength; avoid using AI for tasks where it consistently disappoints.
Pattern B, develop personal patterns. Personal prompting and review patterns produce better results; pattern building takes investment.
Pattern C, voice satisfaction concerns through proper channels. Vendor feedback, team retrospectives, public reviews. Voice channels improve product over time.
The combination produces personal satisfaction improvement that does not require waiting for vendor changes.
The most damaging satisfaction paradox interpretation mistake is treating the paradox as proof AI tools are bad or as proof users are wrong. Both interpretations miss the actual dynamics; tools have real limitations and adoption mandates create real pressure. The fix is to interpret paradox as data revealing complex dynamics rather than evidence supporting predetermined conclusions. Analysts who interpret as data produce better insight than analysts who interpret as evidence.
The other mistake is dismissing satisfaction data because usage continues. Usage persists for many reasons including lack of alternatives; satisfaction independently matters.
A third mistake is over generalizing satisfaction trends. Tool satisfaction varies dramatically by tool, task, and team. Aggregate trends hide important variation.
A fourth mistake is using satisfaction paradox to argue against AI adoption entirely. The paradox describes adoption dynamics, not adoption value; value calculations require additional data.
What This Means For You
The satisfaction paradox reveals that AI coding tool dynamics are more complex than usage growth suggests. The four patterns, causes, and intervention approaches produce framework for navigating the paradox personally and organizationally.
- If you're a senior dev: Track your own satisfaction against your usage; personal data reveals what aggregate data cannot.
- If you're a founder: Add satisfaction tracking to engineering team metrics; satisfaction predicts retention which affects velocity.
- If you're a product manager: Apply paradox thinking to your own product metrics; usage growth without satisfaction growth is a warning sign.
Browse more pulse
Read more pulse