To understand AI coding statistics in 2026 as a complete reference, recognize the four data categories that organize the available data (adoption statistics that show how widely AI coding tools are used, productivity statistics that show what gains adopters report, market statistics that show industry size and growth, and quality statistics that show outcomes including bug rates and security issues), see what the numbers reveal about industry direction, and consider what the statistics mean for your specific decisions about tools, careers, and investments. The statistics provide foundation for thinking beyond anecdote about AI coding direction.
This piece organizes the four data categories with key numbers, what the data reveals, the implications for stakeholders, and the four mistakes statistics interpreters make.
Why AI Coding Statistics Matter
AI coding statistics matter for grounding decisions in data rather than anecdote. The decisions matter; tool choices, career investments, and business strategies all benefit from data grounding rather than relying on individual stories.
The 2026 reality is that substantial data exists but is scattered across surveys, vendor reports, and academic studies. Organizing the data into reference form helps decision makers find the numbers they need without searching multiple sources.
A 2025 meta analysis of AI coding adoption studies found that median adoption rate among professional developers was 76 percent, median productivity gain among adopters was 28 percent, and median time savings was 6 hours per week. The numbers vary substantially across studies; meta analysis produces more reliable estimates than any single study.
The pattern to copy is the way Bureau of Labor Statistics data anchors economic discussions. BLS data may not be perfect but it provides shared reference for economic conversations. AI coding statistics serve similar role for technology discussions; shared reference data enables discussions beyond anecdote.
The Four Data Categories
Four categories organize the available AI coding statistics.
Category 1, adoption statistics. Percent of developers using AI tools (76 percent professional developers globally in 2025), percent of organizations with AI coding adoption (76 percent of Fortune 500), percent achieving full deployment (23 percent of Fortune 500). Adoption is high but uneven.
Category 2, productivity statistics. Median productivity gain (28 percent among adopters), time savings per week (6 hours median), task completion speed (45 percent faster for routine tasks). Productivity gains are real but variable.
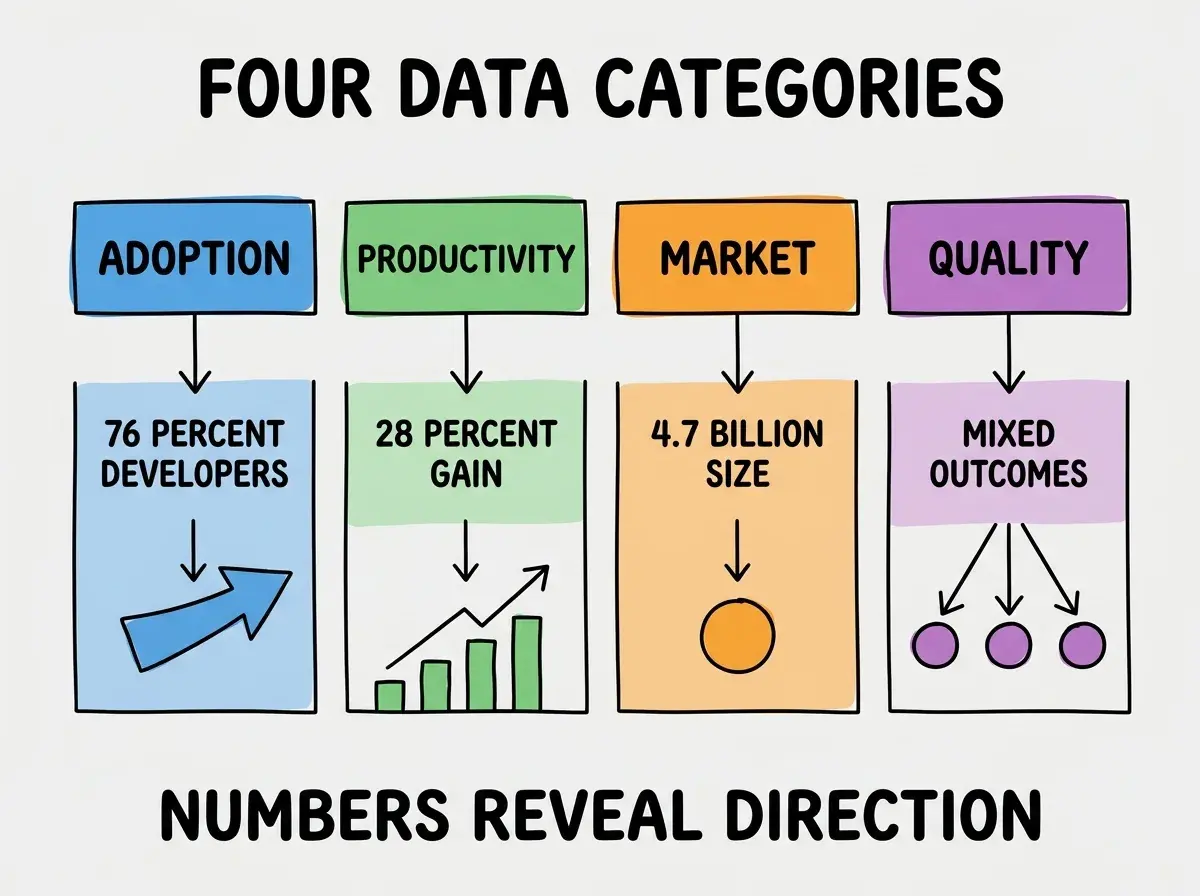
Category 3, market statistics. Total market size (4.7 billion in 2025), projected growth (67 percent for 2026), category breakdown (38 percent tools, 27 percent infrastructure, 19 percent training, 16 percent consulting). Market is substantial and growing.
Category 4, quality statistics. Defect rates in AI generated code (varies 15-30 percent higher than human written without review), security vulnerability rates (varies 20-40 percent higher without scanning), revert rates (41 percent of AI generated code gets reverted within 6 months on average). Quality requires discipline to manage.
What the Numbers Reveal
Three patterns from the statistics reveal industry direction.
Pattern 1, adoption is broad but engagement is uneven. 76 percent of developers use AI tools but only 30 percent report substantial benefit. The gap reveals that mere adoption does not produce productivity automatically.
Browse more data analysis
Read more pulse articlesPattern 2, market growth is accelerating not decelerating. 67 percent projected growth for 2026 exceeds 2024 actual growth. The acceleration suggests the market remains in growth phase rather than approaching saturation.
Pattern 3, quality challenges are real but addressable through discipline. Defect and security rates are higher in AI generated code without discipline; teams with discipline see lower rates. Discipline is the difference between sustainable and unsustainable AI tool use.
What the Statistics Mean For Different Decisions
Three implication patterns matter for different decision types.
Implication 1, tool choice decisions should weight long term factors over current capability. Capability rotates; switching costs rise. Tools chosen for sustained dimensions outlast tools chosen for current capability.
Implication 2, career investments should account for adoption variance. 76 percent adoption with 30 percent substantial benefit means most developers have AI tool exposure but few have AI tool fluency. Career investment in fluency produces differentiation.
Implication 3, business investments should account for market growth and quality challenges. Growing market produces opportunity; quality challenges produce risk. Business strategies that capture growth while managing quality outperform strategies focused only on one dimension.
How to Use Statistics Correctly
Three pattern help statistics consumers apply data correctly.

Pattern 1, use medians rather than averages. AI coding studies often have outliers that distort averages; medians give better central tendency.
Pattern 2, look at distributions rather than single numbers. 28 percent median productivity gain hides that some developers see 60 percent and others see 0 percent. Distribution matters more than median for decisions.
Pattern 3, update expectations quarterly. AI coding statistics evolve fast; statistics from a year ago may not match current reality. Stale statistics produce stale decisions.
How Stakeholders Should Use This Reference
Three application patterns help different stakeholders use the statistics.
Pattern A, founders should use market statistics for go to market decisions. Where the market spends money signals where business opportunities exist. Match business model to spending patterns.
Pattern B, engineers should use productivity statistics for career planning. Skills aligned with high productivity adoption produce career growth. Skills focused on low adoption areas miss the trend.
Pattern C, investors should use growth statistics for investment thesis. Growth rate drives valuation multiples; declining growth rate would change investment thesis dramatically.
The combination produces statistically grounded decisions across different stakeholder roles. Without statistical grounding, decisions rely on anecdote that often misleads.
The most damaging statistics interpretation mistake is treating cherry picked statistics as representative. Vendors cite favorable statistics; critics cite unfavorable statistics; both miss the comprehensive picture. The fix is to look at multiple sources and prefer meta analyses over individual studies; meta analyses average across multiple studies and produce more reliable estimates than any single study could. Single statistics from any single source should be treated with skepticism even when they support your existing position.
The other mistake is treating statistics as predictions rather than current state descriptions. Past statistics describe past states; future projections require additional analysis beyond historical statistics. The fix is to be careful about prediction versus description.
A third mistake is missing the distribution behind aggregate numbers. Aggregate numbers hide variance that often matters more than the average. The fix is to look at distributions when available; aggregate alone can mislead.
A fourth mistake is ignoring the cultural and geographic dimensions of statistics. Most studies focus on Western developers; the patterns may differ for other populations. The fix is to consider geographic and cultural context when applying statistics.
What This Means For You
The AI coding statistics reference provides foundation for grounded decision making across multiple stakeholder roles. The four categories, key numbers, and usage patterns produce framework for thinking about AI coding decisions with data backing.
- If you're a founder: Statistics inform business strategy beyond anecdote. Use market and adoption statistics to guide where to position; the data reveals opportunities that individual stories obscure.
- If you're a senior dev: Statistics inform career strategy. Use adoption and productivity statistics to guide skill investments; the data reveals where career growth opportunities exist.
- If you're a student: Statistics inform education and career path choices. Use adoption rates to understand which markets are growing; the growth markets offer career opportunities.
Browse more data analysis
Read more pulse articles