To calculate revenue analytics correctly for an AI-built SaaS product in 2026, master four formulas that matter most (MRR equals sum of monthly recurring subscription revenue, gross churn equals customers lost divided by customers at start of period, net revenue retention equals starting revenue plus expansion minus churn divided by starting revenue, and LTV equals average revenue per user divided by churn rate), set up the calculations correctly from the start, and review them weekly to catch trends early. Wrong formulas produce wrong decisions; correct formulas surface the trends that matter for business health.
This piece walks through the four formulas, the common calculation errors, the dashboard patterns that surface trends, and the four mistakes founders make when interpreting their revenue metrics.
Why These Calculations Matter More Than They Seem
Revenue analytics drive nearly every important business decision: what to build, who to hire, how much to spend on marketing, when to raise. Wrong calculations produce wrong decisions. Many founders use formulas they learned from blog posts that contained subtle errors; the errors compound across decisions.
The 2026 reality is that revenue analytics fluency separates founders who scale successfully from founders who plateau. The math is not difficult; it just requires correct formulas applied consistently.
A 2025 ProfitWell SaaS metrics study of 2,400 SaaS companies found that 62 percent had at least one significant calculation error in their core revenue metrics. The most common errors were: confusing gross and net churn (38 percent), miscalculating MRR for annual plans (29 percent), and using incorrect LTV formulas (24 percent). Wrong metrics produced wrong decisions across pricing, hiring, and marketing. Getting the math right is one of the highest-leverage tasks a founder can do.
The pattern to copy is the way pilots use checklists for pre-flight calculations. Pilots do not memorize and do approximations; they use formulas and verify each calculation. The cost of being wrong is too high. SaaS revenue analytics deserves the same rigor; the cost of wrong metrics is real, even if less visible.
The Four Formulas That Matter
Four formulas cover what most SaaS founders need to track. Master these and most other metrics derive from them.
Formula 1, MRR (Monthly Recurring Revenue). Sum of all active monthly subscription revenue. Annual plans are divided by 12 to convert. Excludes one-time fees, refunds, and credits.
Formula 2, gross churn rate. Customers lost in period divided by customers at start of period. Measures how many customers leave; does not account for downgrades or upgrades.
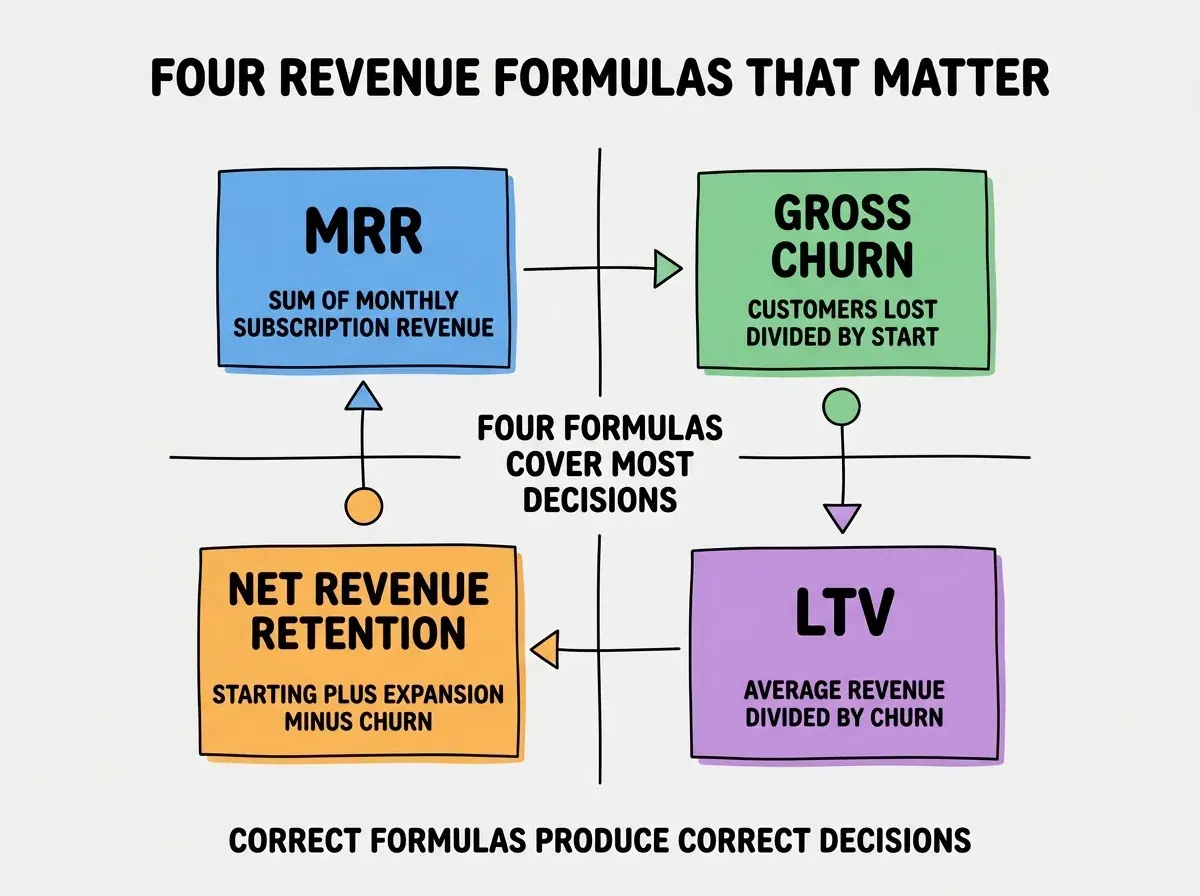
Formula 3, net revenue retention. (Starting MRR + expansion MRR - downgrade MRR - churn MRR) divided by starting MRR. Measures revenue retention including expansion; the most-watched SaaS metric.
Formula 4, LTV (Lifetime Value). Average revenue per user divided by churn rate. The simplest reasonable LTV formula; more sophisticated versions exist but this one suffices for most decisions.
The Common Calculation Errors
Three error patterns appear in most SaaS metric implementations. Knowing them prevents weeks of bad decisions.
Error 1, mixing customer churn and revenue churn. A small customer churning has different revenue impact than a large customer churning. Track both; do not average them.
Browse more SaaS metrics tutorials
Read more grow articlesError 2, miscounting annual plans in MRR. Annual plans should contribute 1/12 of their value to monthly MRR, not their full value. Counting full annual values inflates MRR artificially.
Error 3, using wrong period boundaries for churn. Cohort-based churn (users who started in March, churned in April) differs from period-based churn (any user who churned in April). Pick one consistently; mixing them produces nonsense.
The Dashboard Patterns That Surface Trends
Three dashboard patterns turn revenue calculations into actionable insight rather than vanity numbers.
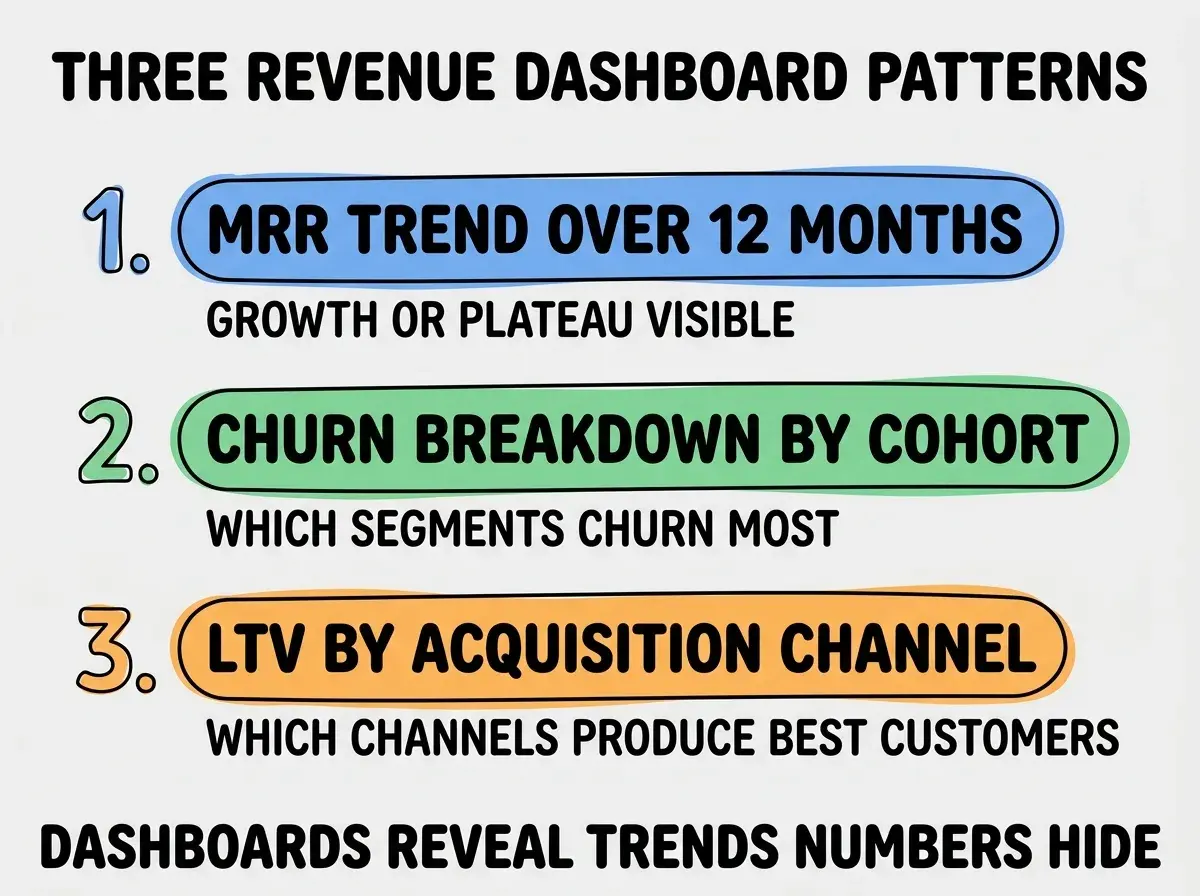
Pattern 1, MRR trend over 12 months. Line chart showing growth or plateau. Reveals whether your business is growing, stable, or in trouble.
Pattern 2, churn breakdown by cohort. Which user segments churn most and least. Reveals retention problems hidden by aggregate metrics.
Pattern 3, LTV by acquisition channel. Customers from different channels have different LTV. Reveals which marketing investments produce the best customers.
How to Handle Edge Cases in MRR Calculation
Three edge cases trip up most MRR calculations. Knowing them prevents distortions.
Case 1, customer pauses subscription. Paused customers should not count as active MRR but should count separately as paused MRR. Counting them as active inflates MRR; counting them as churned overstates churn.
Case 2, customer downgrades mid-month. The downgrade reduces MRR going forward but the current month was already paid at the higher tier. Treat the change as effective at the next billing cycle for MRR purposes.
Case 3, refunds and partial credits. Subtract refunded amounts from MRR in the period the refund was issued, not retroactively. Retroactive adjustments confuse historical comparisons.
The combination handles the edge cases that produce metric drift over time. Without explicit policies on these cases, different team members make different assumptions and metrics diverge.
How to Set Up Revenue Analytics Correctly
Three setup principles produce revenue analytics that work as the business scales.
Principle 1, use Stripe (or your payment provider) as the source of truth. Subscription state lives in Stripe; export to your analytics tool but treat Stripe data as authoritative when discrepancies appear.
Principle 2, calculate metrics in one place, not multiple. If MRR appears in 3 dashboards, all three should pull from the same calculation. Different dashboards showing different MRR numbers destroys trust.
Principle 3, document every calculation. Write down how each metric is calculated; share with the team. The documentation prevents the "wait, how do we calculate MRR again" conversations that waste hours.
The combination produces reliable revenue analytics that scale with the business. Without these principles, metric drift becomes inevitable as the team grows and definitions blur.
The most damaging revenue analytics mistake is treating LTV as a precise number rather than a directional estimate. Founders calculate LTV to two decimal places, then make CAC decisions assuming the LTV is exact. The reality is that LTV depends on churn assumptions that may not hold; a 5 percent churn rate today may be 8 percent next year. The fix is to treat LTV as a range, not a point estimate; use the conservative end for go/no-go decisions, the middle for budgeting, the aggressive end for stretch goals. Range-thinking prevents the false precision that leads to over-spending on customer acquisition.
The other mistake is reviewing metrics monthly instead of weekly. Trends emerge faster than monthly cadence catches; problems compound for weeks before founders notice. The fix is a weekly metrics review (15-30 minutes) that tracks the four core metrics. Weekly review catches problems early; monthly review catches them after they have already done damage.
A third mistake is comparing your metrics to hypergrowth public-company benchmarks rather than to similar-stage private companies. SaaS giants report numbers that took decades to achieve; comparing your year-1 metrics to their year-20 metrics produces unrealistic expectations. The fix is to compare to companies at your stage; the OpenView Partners benchmarks for SaaS companies under $5M ARR provide more useful comparison points than public-company filings.
What This Means For You
Revenue analytics fluency is core founder skill in 2026. The four formulas, common errors, and dashboard patterns produce the foundation; weekly review keeps the data honest.
- If you're a founder: Calculate your four core metrics correctly today. Most founders have at least one error; the cost of finding it is small compared to the cost of making decisions on wrong numbers.
- If you're changing careers into finance or operations: SaaS metrics fluency is increasingly expected for finance roles. Practice with case studies before interviewing.
- If you're a student: Study real SaaS company metrics published in earnings reports. The patterns generalize; the calculations are the same.
Browse more metrics and analytics guides
Read more grow articles