Your app looks fine. No error messages, no red banners, no crashes. But the data never loads, the login silently fails, or the form submission vanishes into the void. Ninety-two percent of developers use AI tools daily to build faster, but AI cannot fix what you cannot see. The problem is almost always a broken API call, and the fastest way to find it is a tool that has been sitting in your browser this entire time.
Think of the Network tab like a mail tracking system. Every time your app sends a request to a server, it is like mailing a letter. The Network tab tracks every single letter your app sends and receives, showing you which ones arrived safely, which ones were returned to sender, and which ones got lost in transit. Without it, you are guessing. With it, you can see exactly where things went wrong and why.
Opening the Network Tab and Getting Oriented
Right-click anywhere on your page and select "Inspect" (or press Cmd+Option+I on Mac, Ctrl+Shift+I on Windows). Click the "Network" tab at the top of the DevTools panel. You will probably see an empty list if you opened it after the page loaded. Refresh the page, and suddenly the panel fills up with rows of requests.
Each row is one "letter" your app sent or received. You will see the resource name, HTTP method, status code, type, size, and how long it took. Most of it is noise when you are debugging API calls. You do not care about the CSS files or font downloads.
Click the "Fetch/XHR" filter button near the top of the panel. This strips away everything except the API calls your JavaScript code made. Now you are looking at the letters that actually matter. Keep the tab open, reproduce the bug, and watch what appears.
Reading Status Codes Like Return Labels
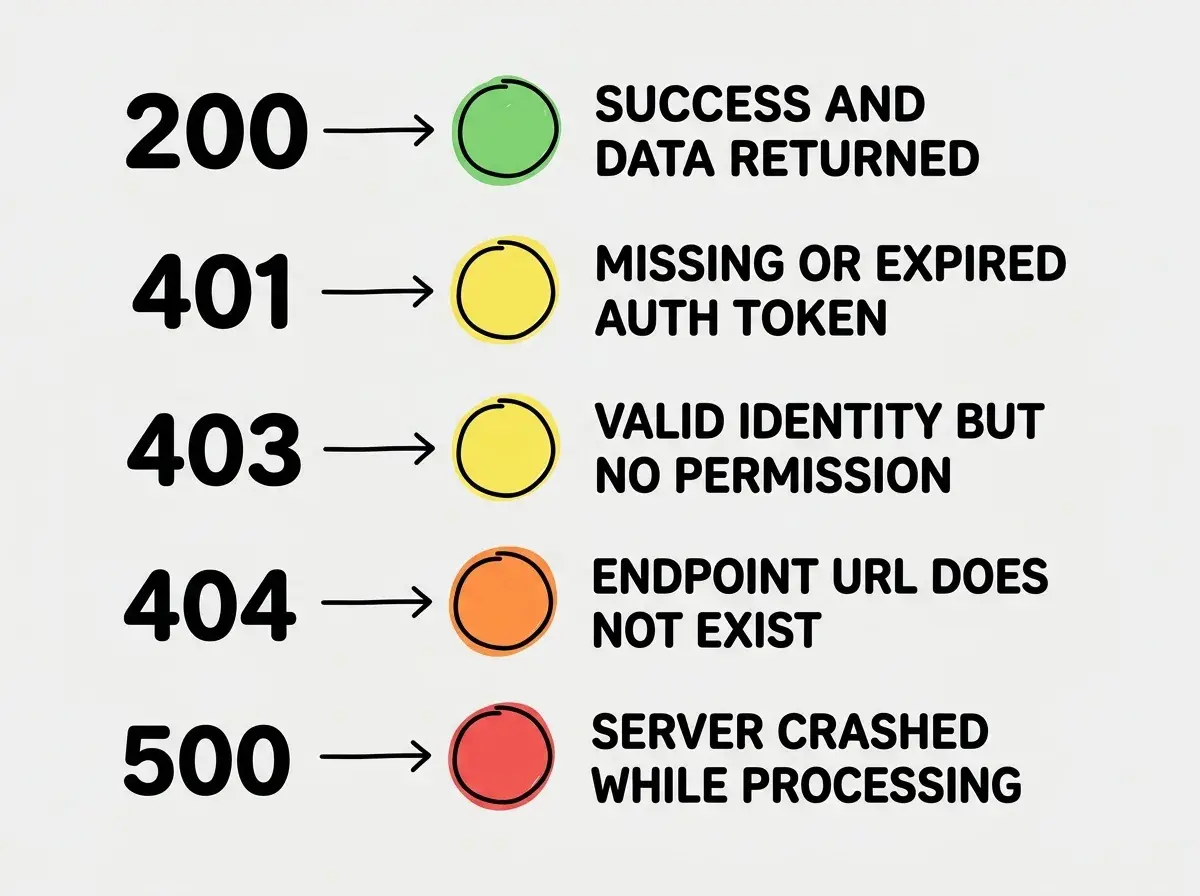
Every API response comes back with a status code. In our mail tracking analogy, this is the return label on each letter. It tells you whether the letter was delivered, rejected, or lost.
200 (OK) means the request succeeded. The server got your letter and sent back what you asked for. If you see a 200 but your app still is not working, the problem is in the response data, not the request.
401 (Unauthorized) means you did not include the right credentials. Your letter arrived, but the recipient said "I do not know who you are." Check the request headers for an Authorization field. If it is missing, your code is not attaching the token.
403 (Forbidden) means the server knows who you are but will not let you in. You do not have permission for this resource. This often shows up when hitting an admin endpoint with a regular user token.
404 (Not Found) means the address does not exist. You sent the letter to a house that is not there. A typo in the endpoint path, a missing ID parameter, or a wrong API version will trigger this.
500 (Internal Server Error) means something broke on the server while processing your request. Check the response body for an error message, then look at your server logs.
Inspecting Request and Response Payloads
Click on any request in the Network tab to open its detail panel. This is where you go from knowing something failed to understanding why it failed.
The Headers tab shows everything about the request your app sent. Check the Request URL, the Request Method (GET, POST, PUT, DELETE), and look for Content-Type and Authorization fields. A missing Content-Type header is a surprisingly common cause of 400 errors. The server expects JSON but your app sent the request without specifying the format.
The Payload tab shows the exact data your app sent in the request body. Check for missing fields, wrong field names, or malformed JSON. Copy the payload, paste it into a JSON validator, and see if the structure matches what the API expects.
The Response tab shows what the server sent back. For failed requests, this often contains an error message like "email field is required" or "token expired at 2026-04-05T23:59:59Z." These messages are gold. They save you hours of guessing.
The Preview tab formats the response as readable JSON with collapsible sections. Use this instead of squinting at raw text.
The Network tab is not just for finding broken requests. It is your single source of truth for what your app actually sent and what it actually received. When your code looks correct but the behavior is wrong, the Network tab shows you the reality your code is living in. Check the URL, the method, the headers, and the payload before you change a single line of code.
Timing Analysis for Slow Requests
Sometimes the API call does not fail. It just takes forever. Click on a slow request and open the Timing tab. You will see a waterfall breakdown including DNS lookup, TLS handshake, waiting for server response (TTFB), and content download.
In most cases, "Waiting (TTFB)" is the bottleneck. That is the time the server spent processing your request. If TTFB is high, the problem is server-side. If the content download phase is long, the response payload might be too large.
Sort all requests by the "Time" column to find the slowest ones. A page that feels sluggish often has one or two API calls taking several seconds while everything else completes in milliseconds.
Common Silent Failures and How to Spot Them
These are the failures that do not throw errors in your console or crash your app. They just quietly break things.
CORS errors are the most frustrating silent failures. Your browser blocks the response because the server did not include the right Access-Control-Allow-Origin header. The request reached the server, the server responded, but the browser refused to hand the response to your code. You will see the request with a red or failed status and no response body. Check the Console tab too, because CORS errors usually log a message there.
Missing auth headers happen when your code forgets to attach the token. The API returns a 401, but if your error handling swallows it or falls through to a default empty state, your app just shows nothing. Click the request, check Headers, and look for the Authorization field.
Wrong URLs are embarrassing but extremely common. You are hitting /api/v2/users but the endpoint is /api/v1/users. Or sending a POST to a URL that only accepts GET. Case sensitivity, trailing slashes, and query parameter formatting all matter.
Silent 200 responses with error payloads are the sneakiest. Some APIs return a 200 even when something went wrong, stuffing the error into the response body. Your code checks for a 200, assumes success, and tries to render an error object as data. Always read the Response tab.
Catching API errors with a generic try/catch that logs nothing or falls through to a default state. When your code does catch (e) { return [] }, every failure looks like "no data" instead of an actual error. While debugging, temporarily remove that catch block or add a console.error(e) so failures surface instead of hiding. You will find problems in minutes that would otherwise take hours.
Learn what matters most when shipping as a founder who codes.
Explore guidesA Practical Debugging Workflow
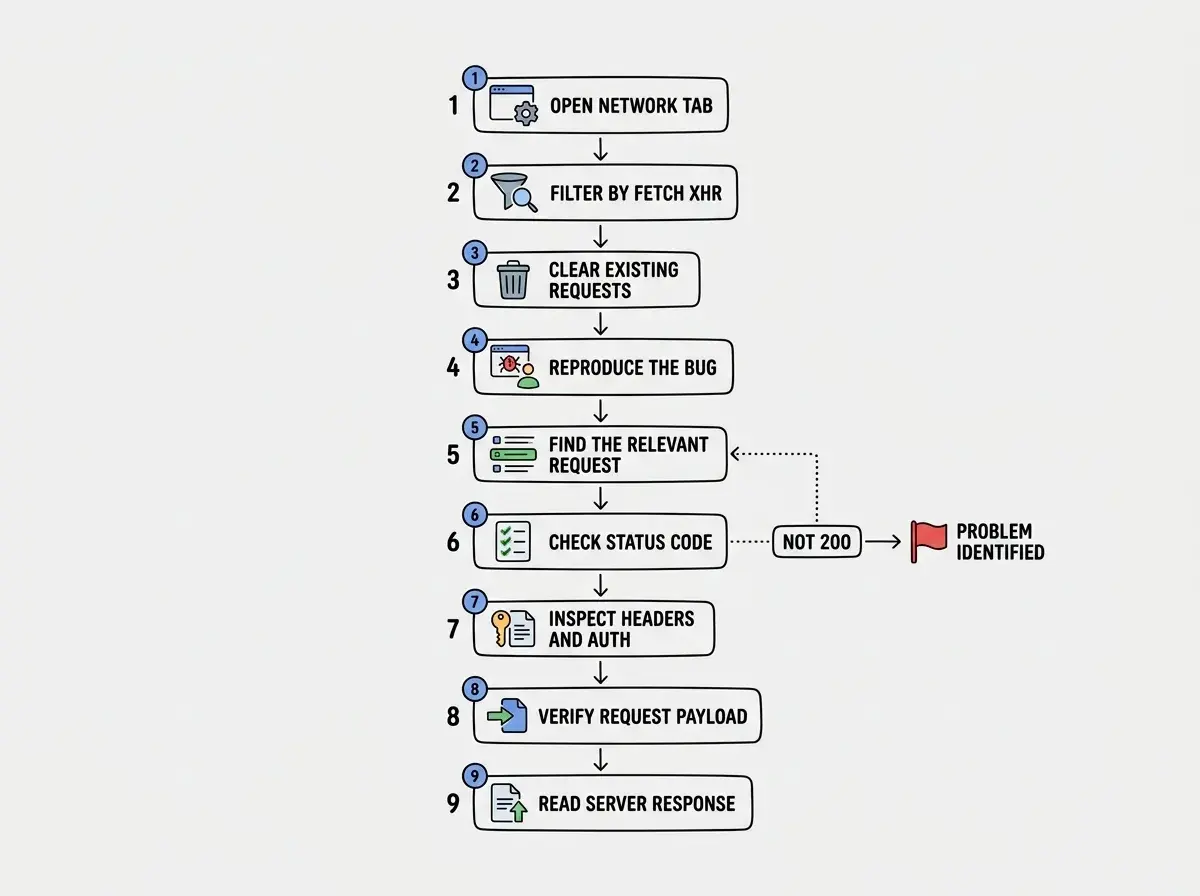
When something is not working, follow this sequence every time. It takes about sixty seconds and eliminates most guessing.
- Open DevTools and switch to the Network tab.
- Click "Fetch/XHR" to filter out noise.
- Clear the existing requests (click the clear button or the circle with a line through it).
- Reproduce the bug by clicking the button or loading the page that is broken.
- Look at the new requests that appeared. Find the one related to your bug.
- Check the status code first. If it is not 200, you already know the category of problem.
- Click the request and check Headers for the correct URL, method, and auth token.
- Check Payload to verify the data your app sent.
- Check Response to read what the server actually returned.
This workflow applies whether you are debugging a login flow, a data fetch, or a file upload. The Network tab does not care what your app is built with. The requests look the same.
What This Means for Your Workflow
The Network tab is the single most underused debugging tool in web development. It has been there in every browser, free, for over a decade. Once you build the habit of opening it first when something breaks, you stop guessing and start diagnosing.
- If you are a founder building with AI: Your AI coding tool generates API calls constantly, and it does not always get the details right. A wrong endpoint, a missing header, a malformed payload. The Network tab lets you verify exactly what your AI-generated code is sending before you spend time rewriting prompts. Check the request first, then decide if the code needs to change. You will ship faster because you are fixing the right thing on the first try.
- If you are a senior dev mentoring a team: Teach your team this workflow before they learn anything else about debugging. When a junior developer says "the API is not working," the first question should always be "what did the Network tab show?" It shifts the conversation from vague descriptions to concrete evidence. Status codes, payloads, and timing data are a shared language that makes debugging collaborative instead of frustrating.
Every API call your app makes is a letter in transit. The Network tab lets you track every single one. Start opening it first, and the bugs that used to take hours will take minutes.
More debugging and shipping guides for builders who use AI.
Browse tutorials