To understand what developer productivity studies actually show about AI tools, recognize the four major findings the studies converge on (productivity gains average 20-30 percent for adopters but distribution is wide with some seeing 60+ percent and others seeing zero, gains vary dramatically by task type with routine tasks showing largest gains, gains correlate with developer experience non linearly with both juniors and seniors gaining more than mid level, and gains compound with team adoption rather than appearing fully at individual adoption), see what the studies reveal beyond marketing claims, and consider what the findings mean for individual and team decisions about AI tool use. The studies provide more nuanced picture than either AI tool vendor marketing or AI tool critic dismissals suggest.
This piece organizes the four major findings, what they reveal, the implications for stakeholders, and the four mistakes when interpreting productivity studies.
Why Productivity Studies Matter
Productivity studies matter for grounding AI tool conversations in evidence rather than anecdote. The grounding matters; AI tool vendors cite favorable claims, critics cite unfavorable anecdotes, and the actual data tells more nuanced story than either side acknowledges.
The 2026 reality is that substantial study data exists about AI coding productivity. The data converges on certain findings while diverging on others; understanding the convergence helps decision making.
A 2025 meta analysis of 47 AI coding productivity studies covering 100,000+ developers found median productivity gain of 28 percent among adopters, with substantial variation by task type, developer experience, and team adoption level. The variation is as important as the central tendency for understanding what AI tools actually deliver.
The pattern to copy is the way medical research handles efficacy studies. Single studies rarely settle questions; meta analyses across many studies produce more reliable conclusions. AI productivity benefits from similar meta analytical thinking; single studies should be treated with skepticism, while meta analyses provide more reliable estimates.
The Four Major Findings
Four findings converge across multiple AI productivity studies.
Finding 1, productivity gains average 20-30 percent for adopters. Multiple studies converge on this range; outliers in either direction exist. Median 28 percent is the consensus point estimate.
Finding 2, gains vary dramatically by task type. Routine tasks (boilerplate, formatting, simple CRUD) show 50+ percent gains; novel architecture tasks show 0-15 percent gains. Task type matters more than developer for individual gains.
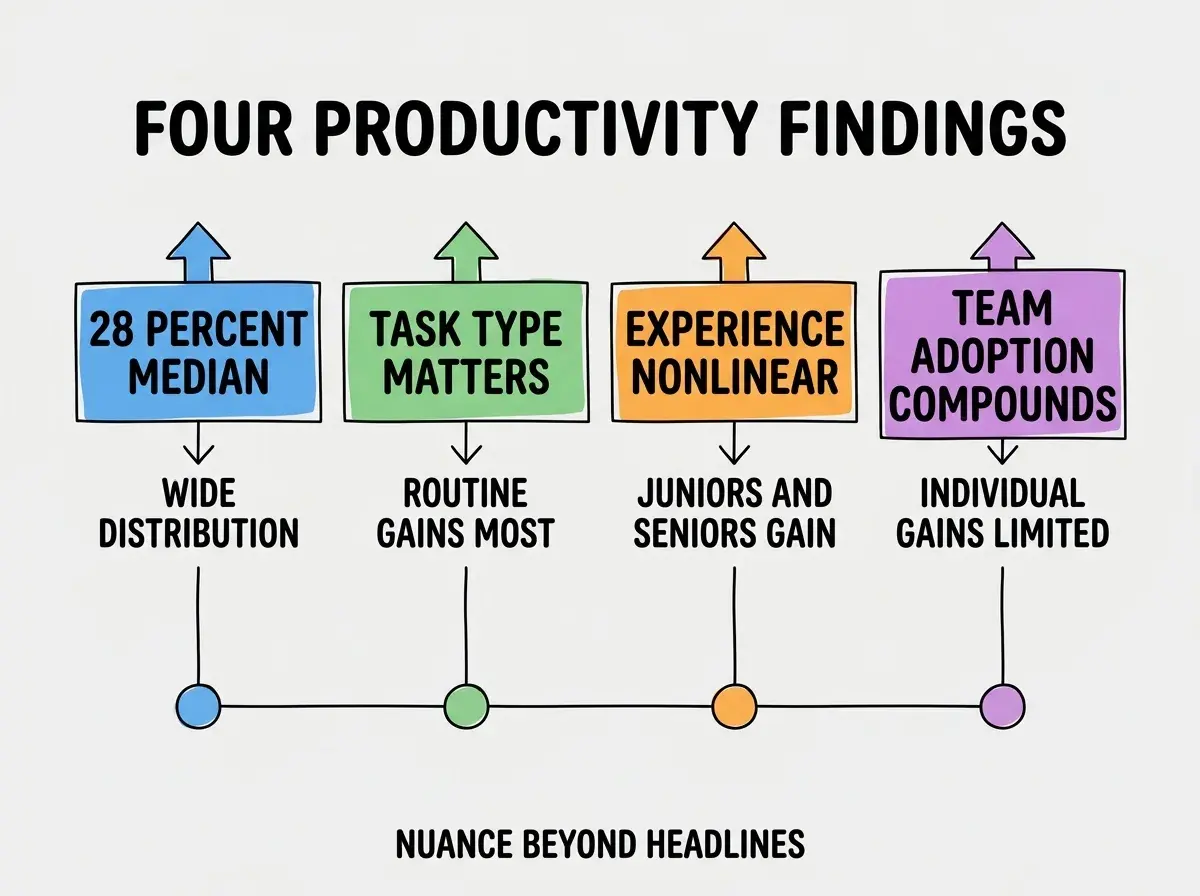
Finding 3, gains correlate with experience non linearly. Junior developers gain most for routine tasks; senior developers gain most for code review and architecture tasks. Mid level developers gain less than either extreme.
Finding 4, gains compound with team adoption. Individual adoption produces individual gains; team adoption produces both individual and team coordination gains. Full team adoption produces gains larger than individual adoption sum.
What the Studies Reveal Beyond Headlines
Three patterns from the studies reveal nuances that headlines miss.
Pattern 1, the distribution is wider than averages suggest. 28 percent average hides that some developers see 60 percent gains and others see zero. Distribution understanding matters for individual decisions.
Browse more developer analysis
Read more pulse articlesPattern 2, productivity gains do not always translate to business impact. Code shipped faster does not always produce faster business outcomes; bottlenecks elsewhere often dominate. Productivity at one stage matters less when other stages are slow.
Pattern 3, productivity costs include cognitive load shifts. Reviewing AI code may cost cognitive energy that pure writing did not. Total cognitive cost may be similar even when shipping speed increases.
What the Findings Mean For Decisions
Three implication patterns matter for different decision types.
Implication 1, individual developers should expect variance in their experience. Your personal gains may differ from average; trying AI tools deliberately reveals your personal productivity pattern.
Implication 2, teams should adopt comprehensively rather than individually. Team adoption compounds beyond individual adoption; partial adoption produces partial gains.
Implication 3, organizations should match tool deployment to task patterns. Teams doing routine work benefit more than teams doing novel architecture; deployment matched to task types optimizes returns.
How Stakeholders Should Apply These Findings
Three application patterns help stakeholders apply productivity findings.
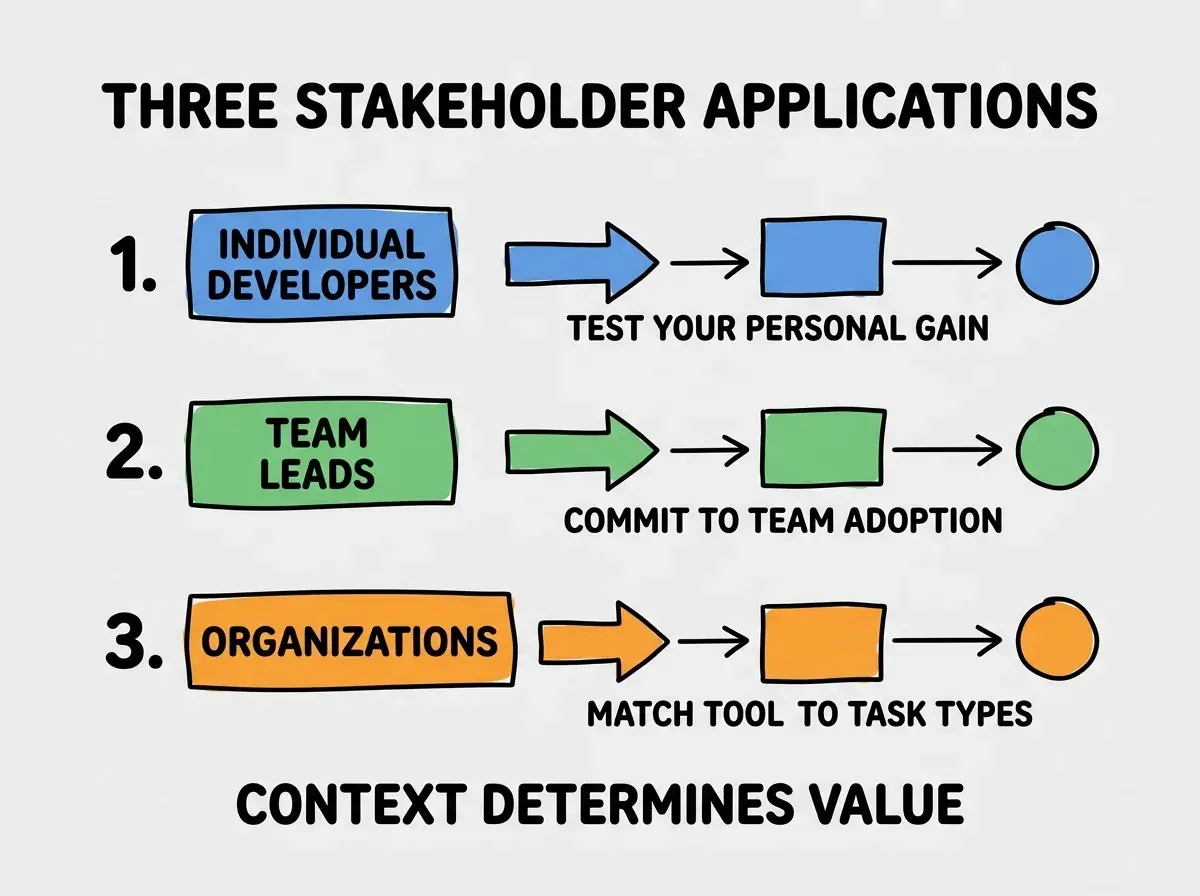
Application 1, individual developers should test their personal productivity gain. Two week trial periods reveal personal pattern. Personal data beats average data for personal decisions.
Application 2, team leads should commit to team adoption rather than individual adoption. Half team adoption produces less than full team gains. Team commitment matters.
Application 3, organizations should match AI tool deployment to task type patterns. Routine task heavy teams benefit more than novel work heavy teams. Targeted deployment produces better ROI than universal deployment.
The combination produces evidence based AI tool decisions across stakeholder roles. Without evidence base, decisions rely on anecdote that often misleads about both upside and downside.
The most damaging productivity study interpretation mistake is treating average gains as universal expectations. Individual gains vary dramatically; expecting average gains for your specific situation often produces disappointment when your situation differs from study averages. The fix is to expect distribution rather than point estimate; your gain may be higher or lower than average depending on your task types, experience level, and team context. Average gains describe populations; individual gains require individual measurement.
The other mistake is using productivity gains as the primary AI tool selection criterion. Productivity is one factor among many; tool fit, team preferences, and switching costs all matter. The fix is to weight productivity alongside other factors; pure productivity optimization can produce wrong tool choices.
A third mistake is missing the time horizon dimension. Short term productivity gains may differ from long term productivity gains as code maturity affects maintenance work. The fix is to consider both short and long term productivity; short term gains alone can mislead.
A fourth mistake is treating productivity studies as final word rather than ongoing research. Studies will continue producing new findings; today's understanding may shift. The fix is to update understanding periodically rather than treating any finding as permanent truth.
How Productivity Studies Will Likely Evolve
Three evolution predictions matter for thinking about future productivity research direction. First, studies will increasingly account for code quality and maintainability rather than just shipping speed; pure speed metrics overstate productivity gains that ignore downstream costs. Second, longitudinal studies will reveal whether early productivity gains sustain over years or fade as code matures; current studies are mostly short term. Third, role specific studies will replace generic developer studies; product engineers, infrastructure engineers, and platform engineers likely show different productivity patterns that aggregate studies obscure.
The research direction matters for builders thinking about long term AI tool strategy. Research that studies the right outcomes informs better decisions than research that studies wrong outcomes regardless of methodological sophistication.
What This Means For You
The developer productivity studies reveal nuanced picture beyond marketing claims or critic dismissals. The four findings, application patterns, and stakeholder implications produce framework for thinking about AI tool use with data grounding.
- If you're a senior dev: Test your personal productivity gain rather than assuming average gain. Personal data informs your personal decisions about AI tool investment and use patterns.
- If you're a founder: Productivity gains are real but variable. Plan based on team and task specific patterns rather than assuming universal gains; targeted deployment produces better ROI than blanket deployment.
- If you're a team lead: Team adoption compounds individual adoption. Drive team adoption commitment; partial adoption produces partial gains that disappoint expectations.
Browse more developer analysis
Read more pulse articles