The code health scorecard for vibe coded projects measures four metrics that predict long term project sustainability: test coverage of critical paths, type safety strictness, dependency freshness, and documentation completeness. Each metric scores 0-10; total score above 30 indicates sustainable project, below 20 indicates rebuild risk. Tracking the scorecard quarterly catches health regression before it forces rebuilds.
This piece walks through the four scorecard metrics, how to score each, what scores indicate, and the four mistakes builders make when measuring code health.
Why Code Health Matters Specifically For Vibe Coded Projects
Code health matters specifically for vibe coded projects because AI generates code volume faster than humans can maintain manually. Without health monitoring, projects accumulate debt that forces rebuilds.
The 2026 reality is that vibe coded projects with low health scores rebuild within 12-18 months; high health scores enable years of sustained development. Health investment determines project lifespan.
A 2025 vibe coded project longevity study of 200 projects found that projects scoring above 30 on health scorecard had average lifespan 3.4 years; projects scoring below 20 had average lifespan 14 months. Health predicts longevity dramatically.
The pattern to copy is the way doctors use vital signs to assess patient health. Single metrics tell partial story; combined metrics reveal patient state. Code health scorecards work the same way; combined metrics reveal project state.
The Four Scorecard Metrics
Four metrics form the code health scorecard.
Metric 1, test coverage of critical paths (0-10). What percentage of critical user flows have tests; 80 percent or higher scores 10.
Metric 2, type safety strictness (0-10). How strictly types are enforced; full strict mode plus no any types scores 10.
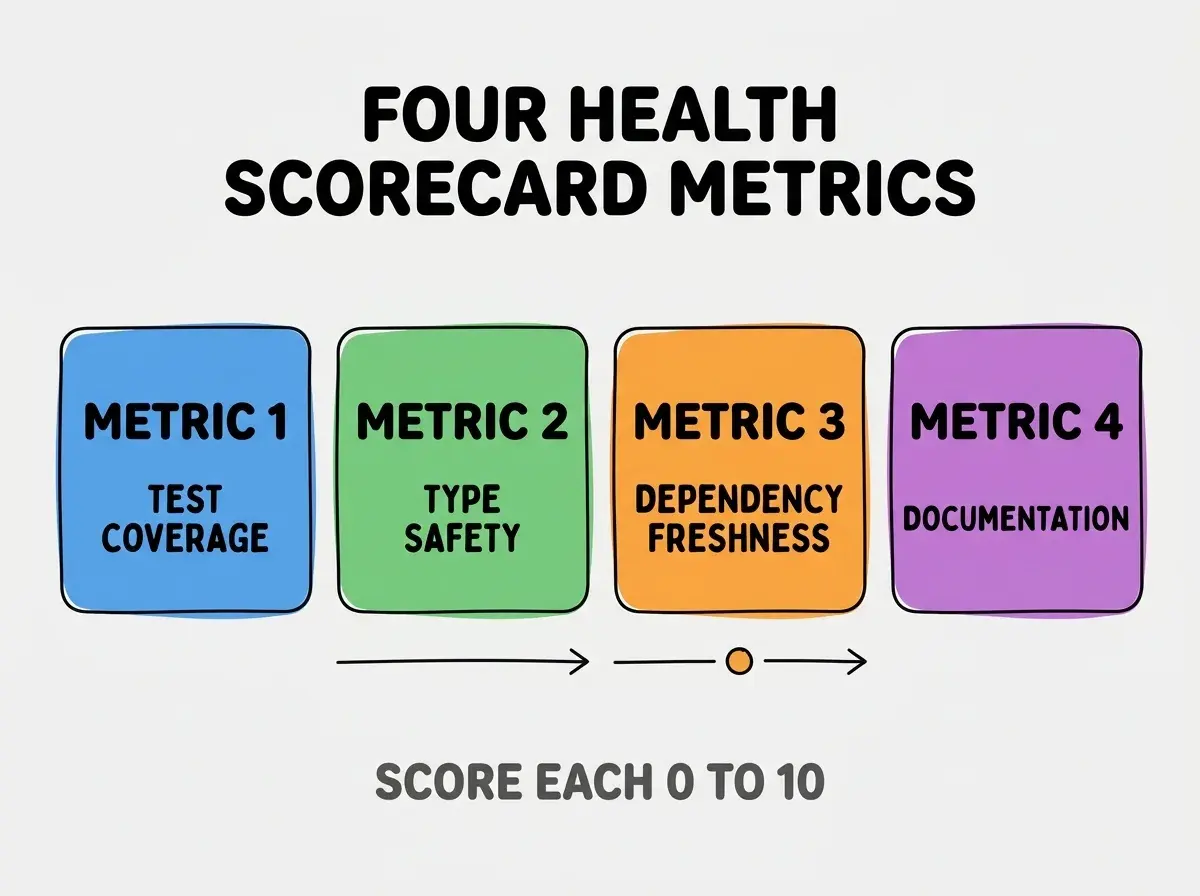
Metric 3, dependency freshness (0-10). How current dependencies are; all updates within last 6 months scores 10.
Metric 4, documentation completeness (0-10). What percentage of public APIs and components have documentation; full coverage scores 10.
How To Score Each Metric
Four scoring approaches make assessment practical.
Scoring 1, test coverage from coverage report. Run coverage tool; check critical path coverage percentage. Map percentage to 0-10 score.
Browse more ship articles
Read more shipScoring 2, type safety from tsconfig. Strict flags enabled, any usage count, type coverage. Combine into 0-10 score.
Scoring 3, dependency freshness from npm outdated. Days since last update per dependency. Average across dependencies for score.
Scoring 4, documentation completeness from coverage tools. Documentation coverage tools report percentage. Map to 0-10 score.
What Scores Indicate
Score ranges indicate different project health states.
Score 30-40, sustainable healthy project. Project can continue developing for years; minor issues not threatening sustainability.
Score 20-30, project needs investment. Specific weak areas threatening sustainability; investment in weak areas required.
Score 10-20, rebuild risk significant. Project decay reaching point where rebuild becomes more attractive than continued maintenance.
Score 0-10, rebuild likely. Project decay so significant that rebuild justified by economics.
What Makes Scorecard Tracking Sustainable
Three patterns separate sustainable scorecard tracking from one off measurement.
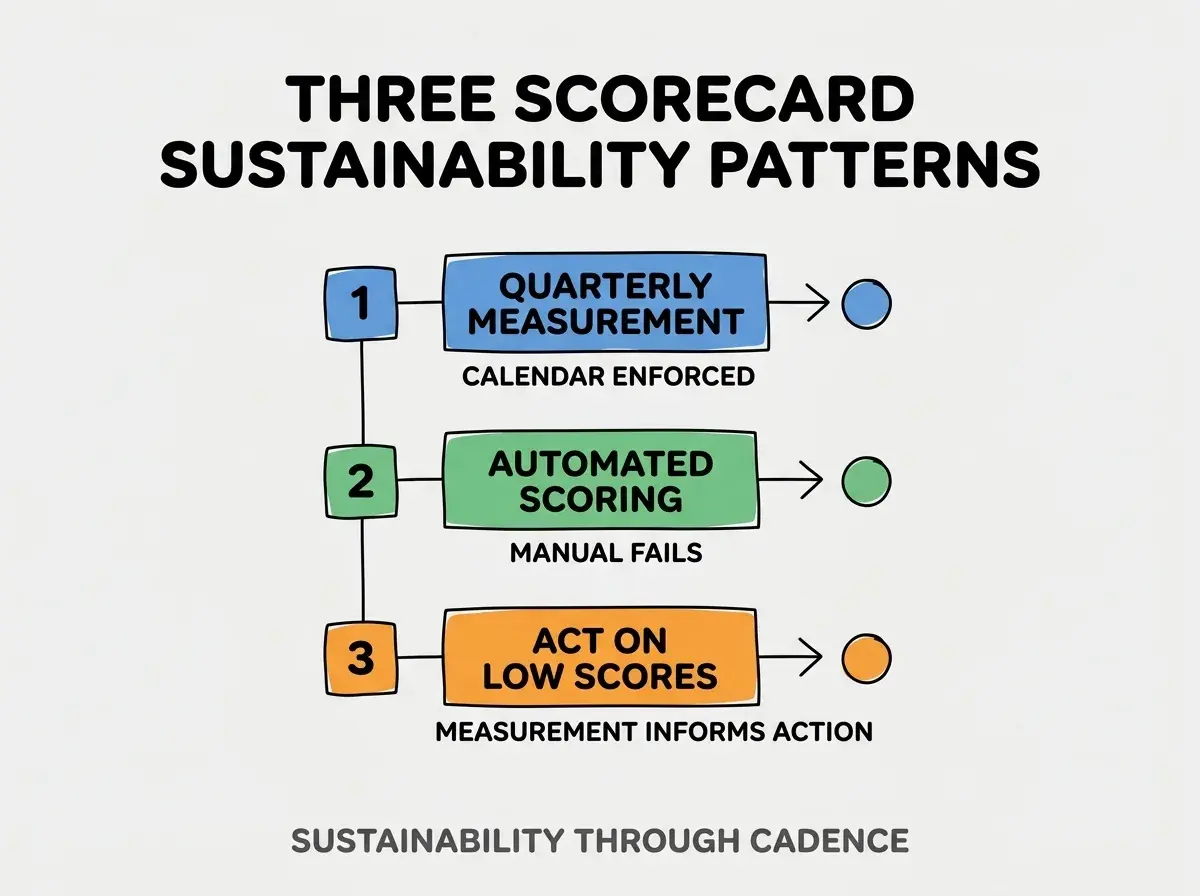
Pattern 1, quarterly measurement on calendar. Quarterly cadence catches drift; less frequent misses gradual changes.
Pattern 2, automated scoring where possible. Manual scoring fails to repeat; automation enables consistency.
Pattern 3, act on low scores immediately. Measurement without action produces no improvement; action required.
The combination produces sustainable scorecard tracking. Without these patterns, scorecards become reports nobody reads.
How To Improve Each Metric
Four improvement patterns address the four metrics.
Pattern A, test coverage improvement through priority paths. Fix critical path tests first; non critical paths follow.
Pattern B, type safety improvement through gradual strict adoption. Enable strict flags one at a time; fix errors per flag.
Pattern C, dependency freshness through scheduled updates. Monthly update windows; consistency prevents large gaps.
Pattern D, documentation improvement through PR template. PR template requires documentation update; template enforces.
Common Questions About Code Health
Code health raises questions worth addressing directly.
The first question is whether scorecard works for solo projects. Yes; solo projects benefit from health awareness too. Scoring same.
The second question is whether to share scores with team. Yes for team projects; shared scores create shared accountability.
The third question is whether scorecard replaces other code reviews. No; scorecard complements review. Both serve different purposes.
The fourth question is how to handle score regression. Investigate cause; address root cause not symptoms. Regression usually has specific trigger.
How Code Health Affects Career Trajectory
Code health affects career trajectory in compounding ways. Career effects compound across years.
The first compounding effect is project portfolio quality. Healthy projects in portfolio differentiate; quality matters for hiring.
The second compounding effect is maintenance vs feature time ratio. Healthy projects spend less on maintenance; more time available for features.
The third compounding effect is reputation as serious builder. Healthy projects signal seriousness; signal affects opportunity.
The combination produces career trajectories shaped by code health habits. Without health attention, careers face quality plateau.
How To Use Scorecard For Decision Making
Three patterns help scorecards inform decisions.
Pattern A, score before adding major features. Low score project should improve before adding features; debt accumulation worsens.
Pattern B, score during hiring decisions. Inheriting low score project requires immediate health investment; hiring should account.
Pattern C, score before client engagements. Client work in low score project produces client incidents; pre engagement health matters.
The combination produces decisions informed by health. Without scorecards, decisions follow assumption.
The most damaging code health mistake is treating it as developer ego rather than project sustainability. Health scoring feels judgmental; reality is sustainability metric. The fix is to frame health as project sustainability, not developer skill judgment; framing enables honest measurement. Builders who measure honestly improve sustainability; builders who avoid measurement face reckoning later.
The other mistake is over engineering for high scores. Scoring 40 on every metric requires effort that rarely pays back; aim for sustainable scores not perfect scores.
A third mistake is missing the action component. Scoring without action produces no improvement; act on findings.
A fourth mistake is treating scorecard as one time exercise. Quarterly cadence required; less frequent misses changes.
What This Means For You
The code health scorecard for vibe coded projects predicts project longevity. The four metrics, scoring approaches, and improvement patterns produce health awareness that compounds across project lifetime.
- If you're a senior dev: Score your projects this week; investment matches what scoring reveals.
- If you're an indie hacker: Health affects business sustainability; healthy projects compound revenue across years.
Browse more ship articles
Read more ship