The state of vibe coding in Q1 2026 reflects a maturing market with four key trends: enterprise adoption accelerating, open source AI tools gaining share, vertical AI tools commercializing, and developer satisfaction stabilizing after declining through 2025. Total market size estimated at $4.7B annually, up 67 percent year over year. The market entering its third year shows maturation patterns that early adopters predicted; new entrants face different dynamics than 2024 entrants.
This piece walks through the four Q1 2026 trends, what data reveals about market maturation, what the trends mean for builders, and the four mistakes when interpreting market data.
Why Q1 2026 State Matters
Q1 2026 state matters because quarterly snapshots reveal market direction. Direction informs strategic decisions across builders, founders, investors.
The 2026 reality is that vibe coding market has matured beyond initial hype phase. Maturation produces different dynamics than early phases; awareness of phase shapes strategy.
A 2025 industry tracking study estimated total vibe coding market at $4.7B annually as of Q1 2026, up 67 percent year over year. Growth continuing but at slower pace than 2024-2025 explosion; maturation pattern matches typical technology adoption curves.
The pattern to copy is the way industry analysts track quarterly state of cloud, mobile, and other technology categories. Quarterly tracking reveals trends; trends inform strategy. Vibe coding market deserves same analytical attention.
The Four Q1 2026 Trends
Four trends characterize Q1 2026 state.
Trend 1, enterprise adoption accelerating. Fortune 500 companies moving from experimentation to deployment; deployment scale dramatically larger than 2025.
Trend 2, open source AI tools gaining share. Open source alternatives reaching commercial viability; share growing from 12 percent to 38 percent year over year.
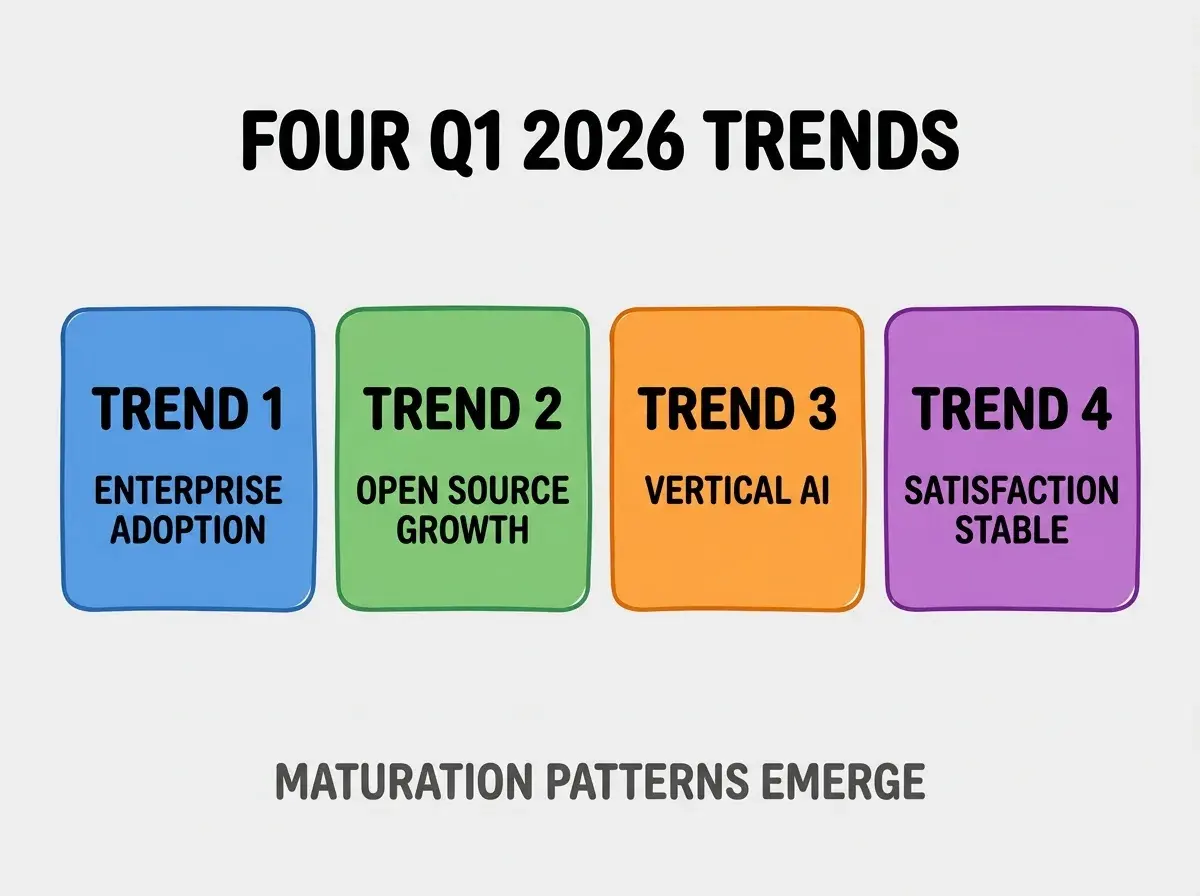
Trend 3, vertical AI tools commercializing. Healthcare, fintech, ecommerce specific tools reaching commercial scale. Verticals beyond horizontal generalists.
Trend 4, developer satisfaction stabilizing. After declining through 2025 (satisfaction paradox), satisfaction stabilized in Q1 2026; tool maturity addressing earlier complaints.
What Data Reveals About Maturation
Three patterns reveal market maturation.
Pattern 1, growth rate decelerating but still substantial. 67 percent yoy growth slower than 2024 (300+ percent) but still substantial; maturation typical pattern.
Browse more pulse
Read more pulsePattern 2, consolidation among tool vendors. Multiple acquisitions in 2025; consolidation continuing into 2026. Fewer winners per category.
Pattern 3, professional services category emerging. Consultants helping enterprises adopt; services category growing alongside tools.
What The Trends Mean For Builders
Three implications matter for builders.
Implication 1, enterprise opportunities expanding. Enterprise adoption opens consulting, vertical tool, professional services opportunities.
Implication 2, open source skills becoming valuable. Open source AI knowledge differentiates; skills compound as share grows.
Implication 3, vertical specialization rewarding. Vertical tools commercializing; specialization opens markets.
What Makes Quarterly Analysis Sustainable
Three patterns separate sustainable quarterly analysis from one off snapshots.
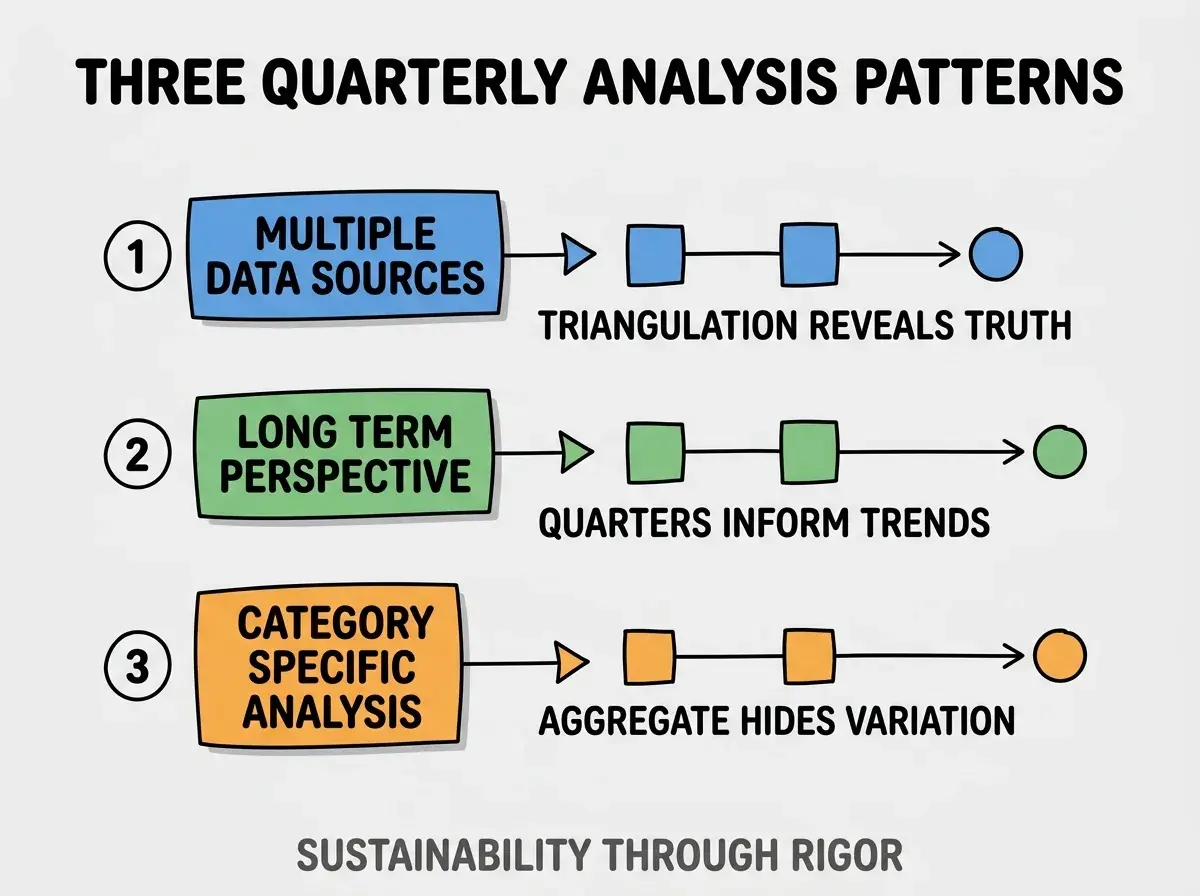
Pattern 1, multiple data sources for triangulation. Single source reveals partial truth; triangulation reveals fuller truth.
Pattern 2, long term perspective on quarterly data. Single quarter noisy; multiple quarters reveal trends.
Pattern 3, category specific analysis. Aggregate hides variation; category analysis reveals nuance.
The combination produces sustainable analysis. Without these patterns, analysis stays superficial.
How To Use Market State For Strategic Decisions
Three application patterns convert market data into strategic decisions.
Pattern A, identify accelerating segments. Accelerating segments offer growth opportunities; deceleration suggests maturity.
Pattern B, watch competitor positioning. Competitor moves signal market direction; signals inform your positioning.
Pattern C, anticipate next phase patterns. Maturation patterns predictable; anticipation enables preparation.
Common Questions About Vibe Coding Market State
Vibe coding market state raises questions worth addressing directly.
The first question is whether market growth will continue. Likely yes through 2026-2027; deceleration to typical mature market growth thereafter expected.
The second question is whether to enter market now. Yes for differentiated approaches; no for commodity entries. Market still growing supports entry.
The third question is whether bootstrap or fundraise. Both viable; fundraise easier when market growing fast.
The fourth question is when to expect market saturation. 2027-2028 typical estimate; saturation patterns vary by segment.
How Market State Affects Career Decisions
Market state affects career decisions in compounding ways. Career effects compound across years.
The first compounding effect is opportunity awareness. Market knowledge reveals opportunities; opportunities inform career moves.
The second compounding effect is timing of skill investment. Skills aligned with market direction compound; misaligned skills become obsolete.
The third compounding effect is location decisions. Hot markets concentrate geographically; awareness informs relocation decisions.
The combination produces career trajectories shaped by market awareness. Without awareness, career decisions follow chance.
How To Track Market State Personally
Three patterns help individuals track market state.
Pattern A, follow industry analysts and reports. Gartner, Forrester, IDC all publish; subscriptions expensive but worth it for serious tracking.
Pattern B, monitor public company earnings calls. Microsoft, Google, others discuss AI tool market; calls reveal trends.
Pattern C, attend industry conferences. Conferences reveal what vendors and customers discuss; attendance produces insider awareness.
The combination produces market tracking that compounds awareness. Without tracking, market knowledge stays superficial.
The most damaging market analysis mistake is over interpreting single quarter data points. Quarterly data noisy; single quarter rarely indicates real trend. The fix is to look at multi quarter trends; trends inform decisions, points inform speculation. Analysts who follow trends produce useful analysis; analysts who emphasize quarters produce noise that misleads.
The other mistake is treating vibe coding market as monolithic. Categories within market behave differently; nuance matters.
A third mistake is missing the open source signal. Open source share growth has implications; ignoring open source misses important shift.
A fourth mistake is over weighting recent data. Recent data emotional; multi year perspective produces better strategy.
What This Means For You
The state of vibe coding in Q1 2026 reflects market maturation patterns that inform strategic decisions across roles. The four trends, implications, and tracking patterns produce market awareness that compounds across career.
- If you're a founder: Position for maturing market dynamics; early stage strategies may not work in maturing market.
- If you're a senior dev: Track open source AI growth; open source skills compound as share grows.
- If you're a product manager: Vertical AI emergence creates product opportunities; explore vertical opportunities.
Browse more pulse
Read more pulse