A health check is a tiny endpoint your app exposes that answers one question, am I working right now. An uptime monitor is a service that asks that question every minute or two and screams when the answer is no. Together they cost about ten minutes to set up and roughly five dollars a month, and they replace the worst feeling in software, learning your app is broken from a customer.
This guide walks through what a real health check should test, how to wire up monitoring on Better Stack or Uptime Robot, and how to pick alert thresholds that catch outages without paging you for every blip.
Why a Liveness Probe Is Not Enough
The default health check pattern most frameworks ship is a single endpoint that returns 200 OK. It tests one thing, that the web server process is alive. The problem is that the web server being alive is rarely the actual question. The question users care about is, can I sign up, can I see my data, can I check out. A 200 from a liveness probe answers none of those.
A useful health check tests the dependencies your app cannot work without. For most vibe coded apps that means three things, the database, the authentication provider, and the most critical third-party API in the request path. If any of those is down, your app is effectively down even though the web server is happy to keep returning 200s.
A 2024 industry survey of small SaaS operators found that 71% of incidents were detected by a customer email or social media post, not by monitoring. The fix is almost always a better health check, not a more expensive monitoring service.
The pattern to copy is the airline preflight check. Pilots do not check the engine status by listening for an engine, they check the engine status by reading instruments connected to specific subsystems. Your health check should do the same, query each subsystem and report which ones are healthy, not just whether the process is running.
Building a Real Health Endpoint
Here is the structure of a health endpoint that actually tells you something useful. The example is a Next.js route handler, but the pattern translates to any framework.
// app/api/health/route.ts
export async function GET() {
  const checks = await Promise.allSettled([
    checkDatabase(),
    checkAuthProvider(),
    checkPaymentApi(),
  ]);

  const results = {
    database: checks[0].status === 'fulfilled' ? 'ok' : 'down',
    auth: checks[1].status === 'fulfilled' ? 'ok' : 'down',
    payments: checks[2].status === 'fulfilled' ? 'ok' : 'down',
  };

  const allHealthy = Object.values(results).every(v => v === 'ok');

  return Response.json(
    { status: allHealthy ? 'healthy' : 'degraded', checks: results },
    { status: allHealthy ? 200 : 503 }
  );
}
The important details are easy to miss. Promise.allSettled runs every check in parallel, so the total response time is the slowest single check, not the sum of all of them. The status code is 503 (Service Unavailable) when anything is degraded, which is what monitoring tools are looking for. And every check runs with a short timeout (covered below), so a slow database does not turn your health endpoint into a slow endpoint.
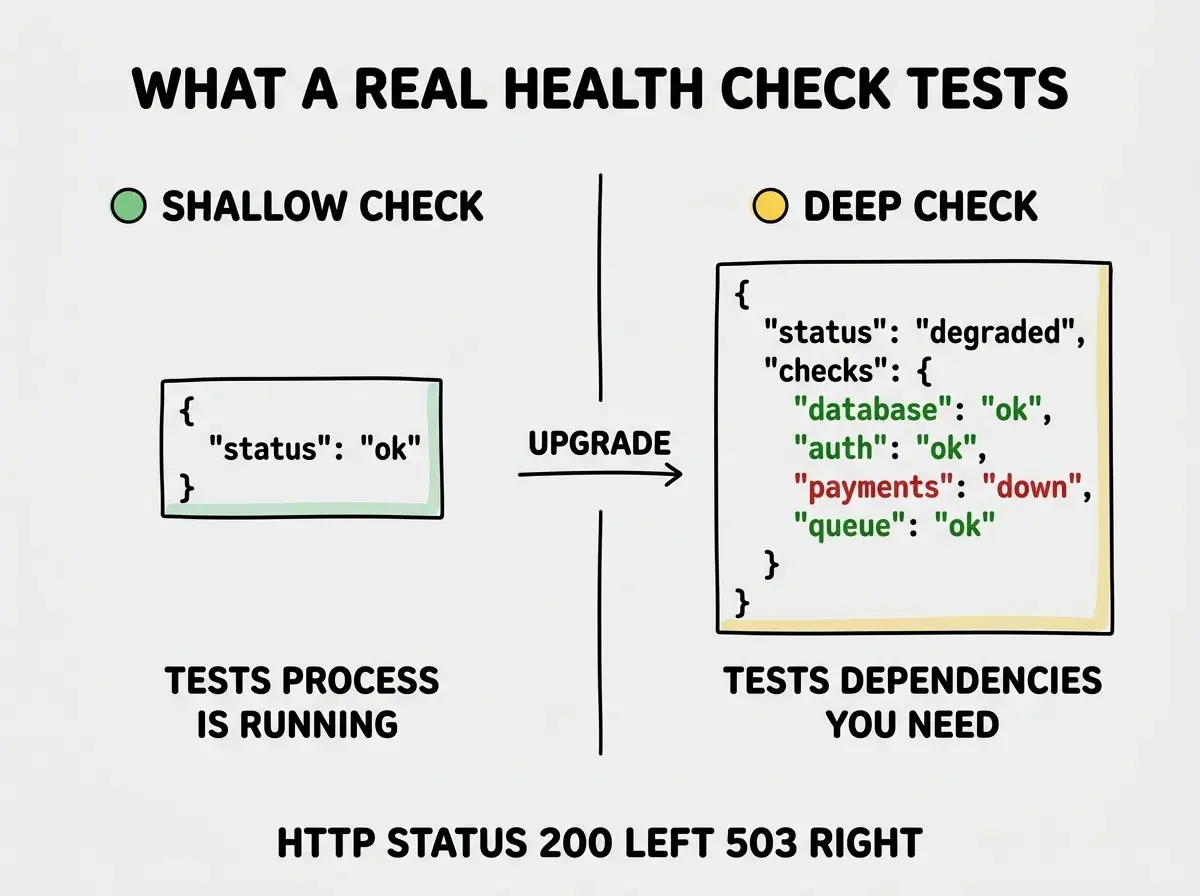
Each individual check function should do the smallest meaningful operation against its target. For the database, that is a SELECT 1 against the connection. For an auth provider, it is a GET on a documented health endpoint they expose. For a payment API, it is usually a GET on a low-cost endpoint like a list of products with limit=1. Avoid running expensive queries in your health check, you do not want the act of monitoring to become a performance problem.
Setting Up the Uptime Monitor
The endpoint above is useless without something pinging it on a schedule. The two services I recommend for solo builders are Better Stack and Uptime Robot. Both have free tiers, both support 1 to 3 minute check intervals, and both can alert by email, SMS, push notification, and webhook.
Configure the monitor to ping /api/health every minute. Set the expected status code to 200. Set the timeout to whatever your slowest legitimate check takes plus a safety margin (start with 10 seconds and adjust). Then add a second monitor for your homepage URL with a less aggressive interval, every 5 minutes is fine, just to catch the case where your CDN or routing layer is broken even if the API is up.
Browse more reliability and observability guides for AI-built apps
Read more ship guidesThe number that decides your alert quality is the failure threshold, how many failed checks in a row trigger a page. Setting it to 1 means you get woken up every time a network hiccup causes a single failed ping. Setting it to 5 with a 1 minute interval means a 5 minute outage before you find out, which is a lifetime if a customer is mid-checkout. The right answer for a small team is usually 2 or 3 consecutive failures, which weeds out noise but still catches outages within a few minutes.
Picking Alert Channels and Schedules
The alert channel matters more than people expect. An email alert at 3am is useless if your phone is on silent. An SMS alert at 3am is useful but expensive at scale. A push notification through a dedicated app like PagerDuty or incident.io is what a real on-call rotation uses, but those services start at fifteen to twenty dollars per user per month.
For a solo builder, a workable cheap setup is, email for low-severity (response time over threshold, single failed check), Slack or Discord webhook for medium severity (multiple consecutive failures during business hours), and SMS or phone call for high severity (extended outages, payment system down). Better Stack and most monitoring tools let you configure these tiers in their UI, you do not need to build a custom system.
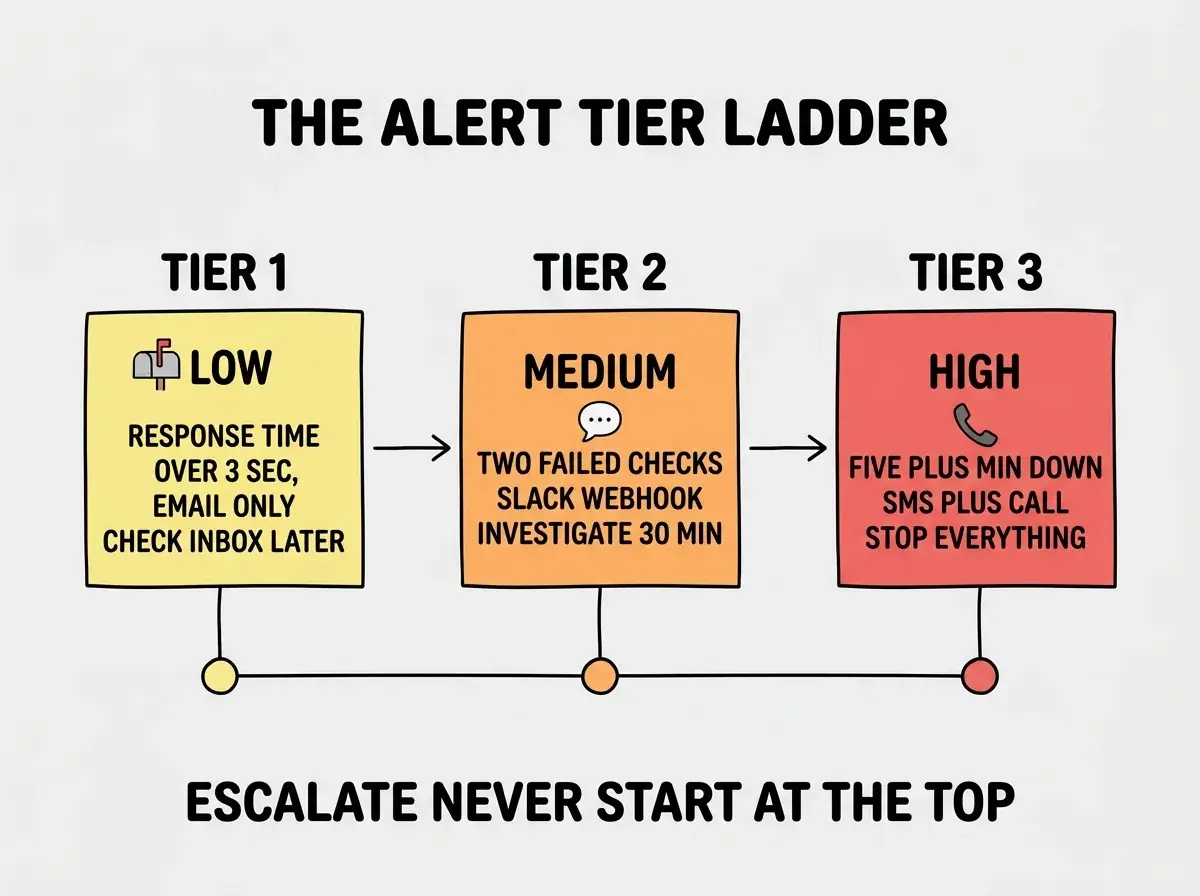
The other thing to configure is alert suppression during deploys. Most monitoring tools support a maintenance window or scheduled silence. If you do not configure this, every deploy that takes longer than your check interval will fire a false alarm, you will start ignoring alerts, and you will miss a real one. Better Stack and Uptime Robot both expose a webhook you can call from your CI pipeline to silence alerts during deploys.
Beyond Up or Down
A binary up/down monitor catches outages but misses degradation, the slower failure mode where the app technically responds but takes 30 seconds to load a page. Catching degradation requires response time tracking with alerts on percentile thresholds, usually p95 or p99 latency.
The setup is simple, configure your uptime monitor to alert when response time exceeds a threshold for several consecutive checks. A reasonable starting threshold for a small app is 2 seconds for p95 response time, 5 seconds for p99. If you do not know what your normal response time is, run for a week with no threshold and check the dashboard. Pick a threshold about 50% above your typical p95.
The most common health check mistake is testing the endpoint by visiting it in a browser, seeing 200 OK, and considering the job done. Always test failure paths too. Disable the database connection string in a staging environment and confirm your health endpoint returns 503, not 200, before you trust it in production.
The other thing worth tracking is synthetic transaction monitoring, scripts that simulate a real user journey (load homepage, sign in, view dashboard) and alert if any step fails. Every uptime tool supports this, though usually on a paid tier. The reason it is worth paying for, a synthetic transaction catches bugs that a single endpoint check cannot, like an authentication flow that returns 200 with a corrupted session cookie.
What This Means For You
Health checks and uptime monitoring are the cheapest insurance you can buy for a production app. Ten minutes of setup, free tier services, and one well-designed endpoint are enough to flip the dynamic from "users find bugs first" to "I find bugs first."
- If you're a founder: Set this up before your first paid customer. Customers tolerate bugs you knew about and were already fixing. They do not tolerate bugs you learned about from them.
- If you're changing careers: Building a deep health check is a great portfolio exercise. It shows operational thinking, not just feature work, and is exactly the kind of judgment hiring managers look for.
- If you're a student: Ask your AI to build this for any class project. Then break the database connection on purpose and confirm the endpoint correctly reports degraded. That five-minute test teaches more than a textbook chapter.
Read the rest of the production readiness series
Browse the ship category