Analytics for vibe coders means tracking the eight events that tell you whether your product is actually working: page view, signup, activation, first key action, paid conversion, repeat usage, churn signal, and feature adoption. Adding these from day one takes about 90 minutes and produces decisions you can make confidently for the next two years. Skipping them, which is the default for most vibe-coded products, leaves you guessing about every important question and forces you to retrofit instrumentation later, when adding it is 10x more work.
This piece walks through the eight events, the right tools to use (Posthog, Plausible, Amplitude), and the four mistakes that make analytics useless even when you do collect data.
Why Day One Analytics Matters
The single biggest reason to instrument analytics from day one is that retrofitting them is painful and inaccurate. Adding event tracking to an existing product means rewriting components, redeploying, and waiting weeks for enough data to accumulate. Adding the same tracking before your first user lands gives you clean data from day one and lets you make decisions on real evidence within a few weeks.
The other reason is psychological. Founders who do not have analytics make decisions based on whoever sent the loudest tweet last week. Founders who do have analytics make decisions based on what users actually do, which is almost always different from what users say. The gap between the two is where most early product mistakes happen.
A 2025 ProductHunt analysis of 1,000 launched products found that products with at least basic analytics from day one were 3.4x more likely to still be running 12 months later than products without analytics. The difference was not the data itself; it was that the founders made fewer wrong calls because they could see what was happening.
The pattern to copy is the introduction of GPS to long-distance driving. You can drive across the country without a map, and many people did before 1995. But once GPS was free in every phone, the cost of staying lost became absurd. Analytics is GPS for product decisions. The question is not "do I need it" but "why would I drive blind."
The Eight Events to Track
Each of these maps to a specific decision you will need to make in your first year. Tracking them is mostly about adding 5 to 10 lines of code per event using your analytics SDK.
1. Page view. Where users land and what path they take through the product. This is automatic in most analytics tools but worth confirming. Without page view tracking, you cannot answer "where do users drop off."
2. Signup. Every account creation, with the source (organic, ad, referral) attached. Without signup tracking, you cannot answer "what is bringing users in."
3. Activation. The single moment a user does the thing your product is for. For Slack, it was sending the first message. For Dropbox, it was uploading the first file. Define this for your product and track it explicitly.
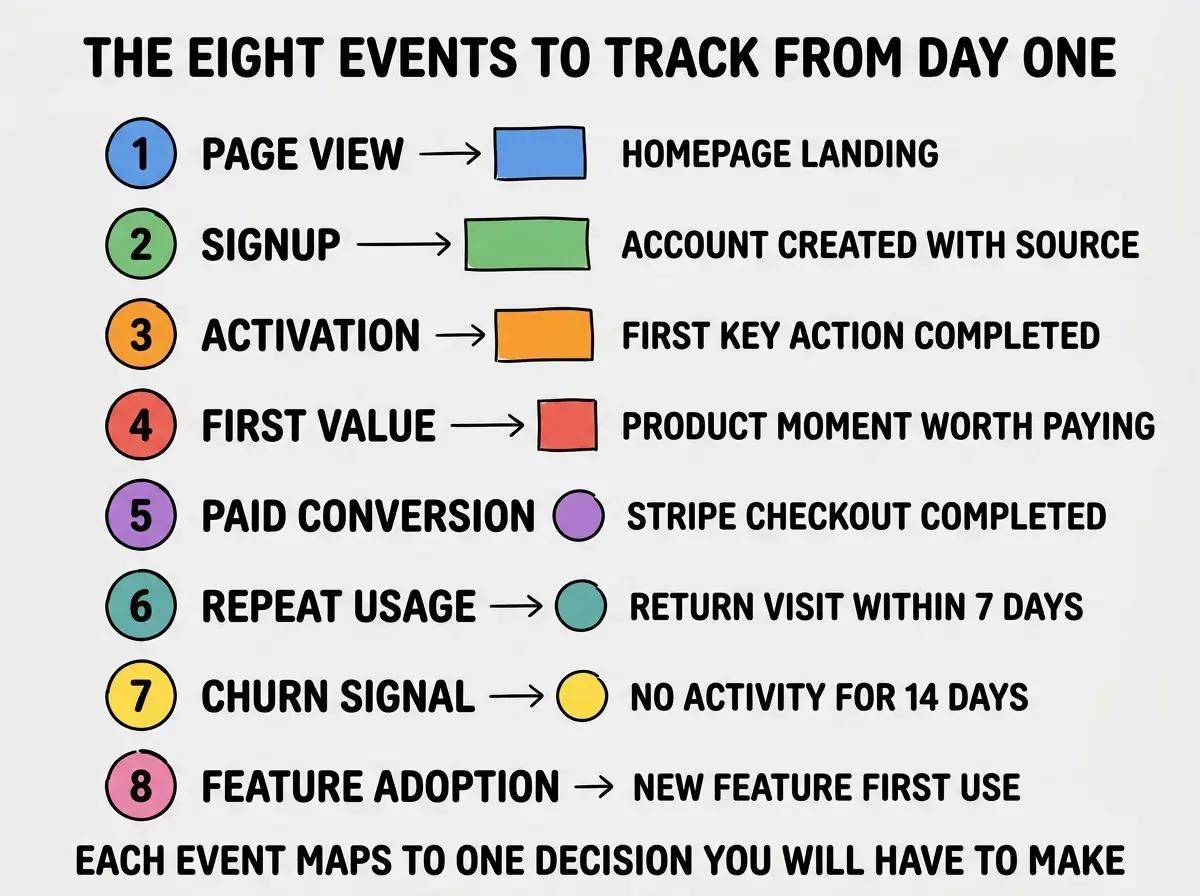
4. First value. A slightly later event than activation. The moment the user gets enough value to be willing to pay. Often the same as activation, sometimes one or two steps later.
5. Paid conversion. Stripe checkout completed (or whatever payment provider you use). Always tie this back to the user ID so you can connect revenue to acquisition source.
Events 6 Through 8 and the Right Tool
The remaining three events are the ones that show up in week 4 to week 12 as your most useful data, even though they are easy to forget at launch.
6. Repeat usage. A return visit within some defined window (often 7 days). This is your retention signal. Without it, you do not know if your product is sticky.
Browse more growth and measurement guides
Read more grow articles7. Churn signal. No activity for some defined window (often 14 or 30 days). Track this so you can build re-engagement flows for at-risk users before they fully leave.
8. Feature adoption. First use of any new feature you ship. Track this for every release so you can tell which features matter and which were a waste of time.
Picking the Right Analytics Tool
For most vibe-coded products, three tools cover almost every case. Pick one and avoid the temptation to use multiple.
Posthog is the default recommendation for most builders in 2026. It is open source, has a generous free tier (1 million events per month), and combines product analytics with feature flags, session replay, and surveys. Setup is a 5-minute snippet and a 30-minute event taxonomy.
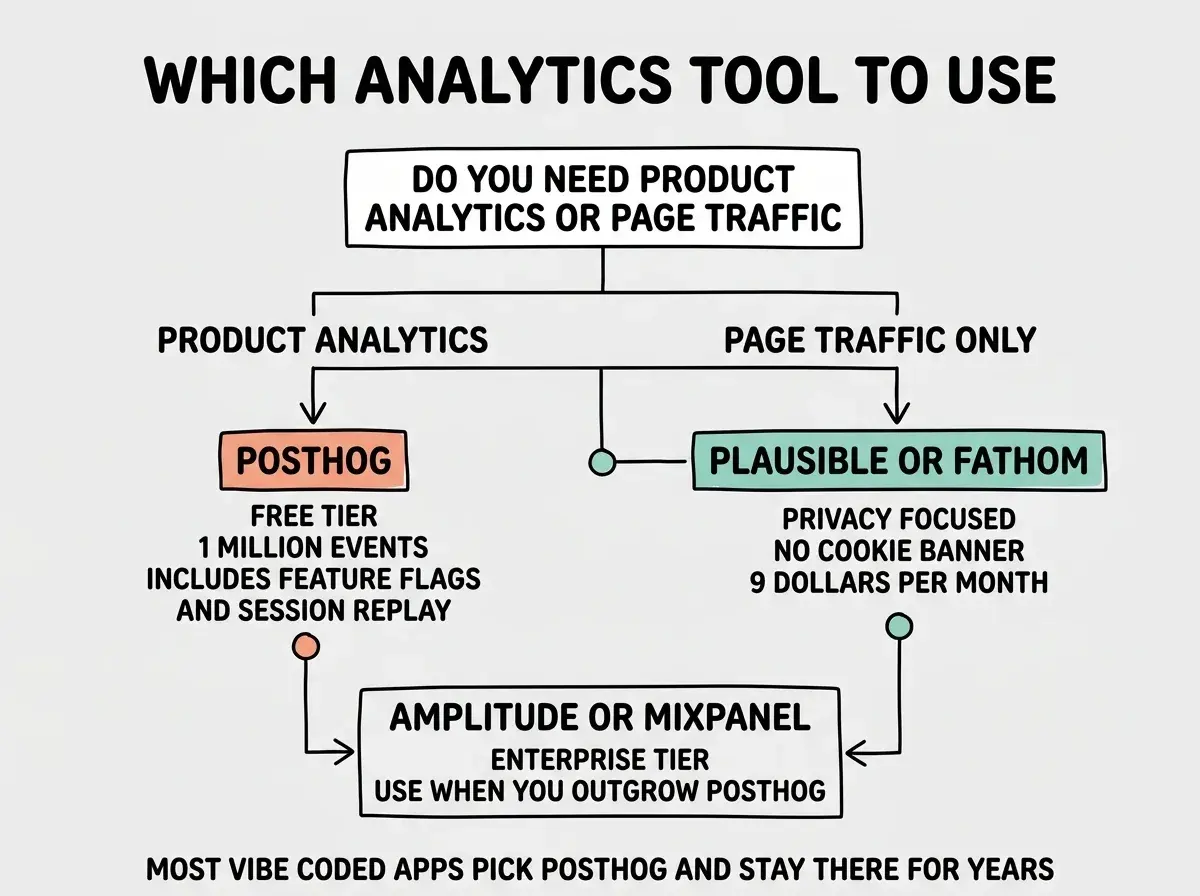
Plausible or Fathom is the right pick if you only need page traffic and want a privacy-focused tool with no cookie banner. About $9 per month, 5-minute setup, no event tracking but very clean dashboards.
Amplitude or Mixpanel are the enterprise-tier picks. Use them only if you have outgrown Posthog or specifically need their advanced cohort and behavioral analysis. Most vibe-coded products do not need these in their first 18 months.
The single most expensive analytics mistake is tracking too many events with no taxonomy. If you log 200 different events with names like "buttonclick" and "userdid" and no consistent properties, the data is unusable for cohort or funnel analysis. Pick the eight events above, name them consistently (verb-noun, like "signup-completed" or "feature-adopted"), attach a small set of properties to each, and resist the urge to track everything.
The other mistake is treating analytics as a launch task and never revisiting them. The right cadence is a 30-minute analytics review every Friday. Look at the funnel, identify the weakest step, and ship a fix the following week. This rhythm produces compounding improvements that founders without analytics never see.
A related discipline is to write a one-paragraph note each Friday describing what you saw and what you decided to do. After 12 weeks you have a journal of decisions and the data behind them, which becomes invaluable when something stops working and you need to figure out what changed. Most founders skip this step and end up re-deriving the same insights every quarter. The ones who keep the note are noticeably faster at every product decision after month three.
The weekly cadence also changes how you ship. Knowing that the funnel will be reviewed on Friday creates a small but real pressure to actually look at it, which is the whole point. Without the calendar block, the data sits unread.
What This Means For You
Analytics from day one is a low-effort, high-leverage investment that pays off every week for the life of your product. Skipping it makes every product decision harder than it needs to be.
- If you're a founder: Pick Posthog, set up the eight events above today, and review them every Friday. The compounding effect over a year is enormous.
- If you're changing careers: Learning to read funnels, cohorts, and retention curves is one of the most transferable PM skills in 2026. Build the habit on your own product first.
- If you're a student: Instrument your portfolio projects with Posthog's free tier. Showing real user data in interviews is more impressive than describing the product.
Browse more growth and analytics guides
Read more grow articles