Vibe coding adoption is highest in APAC in 2026, with India alone accounting for roughly 16.7 percent of all global vibe coding tool usage, followed by Indonesia, Vietnam, and the Philippines. The US comes in fourth on a per-capita basis despite being the largest market in absolute revenue terms. The pattern is driven by a combination of large young developer populations, lower legacy software burden, and a cultural openness to AI-assisted workflows that has not yet developed in the West. Understanding the geographic distribution helps founders make better decisions about hiring, market entry, and tool localization.
This piece walks through the global adoption data, explains the structural drivers behind the APAC lead, and identifies the markets where adoption is accelerating fastest in late 2026.
Why APAC Adopted Faster
Three structural factors explain the APAC lead in vibe coding adoption. First, the developer population is younger on average. The median software engineer in India is 28 years old; the median in the US is 42. Younger developers adopt new tools faster and have less attachment to existing workflows.
Second, the legacy software burden is smaller. APAC startups, especially in Indonesia, Vietnam, and the Philippines, are building greenfield products without 10 years of accumulated technical debt to maintain. Vibe coding shines on greenfield work and struggles on large legacy codebases. The work-AI fit is structurally better in APAC.
A 2026 Stack Overflow regional survey found that 87 percent of developers in India use AI coding tools daily, compared to 64 percent in the US and 52 percent in Western Europe. The trust gap was equally stark: 51 percent of Indian developers said they trusted AI output for production code, versus 27 percent in the US. Trust and usage move together, and APAC moved earlier on both.
The third factor is a cultural openness to new tools. APAC tech ecosystems have historically leapfrogged Western patterns (mobile-first banking, super-apps, QR-code payments), and AI coding is the latest in that line. The willingness to try new approaches without first building consensus is higher than in slower-moving Western enterprises.
The Global Distribution
Looking at the data by region rather than by country tells a clearer story. Developer tool usage measured by active monthly users of Cursor, Claude Code, and GitHub Copilot follows a recognizable pattern.
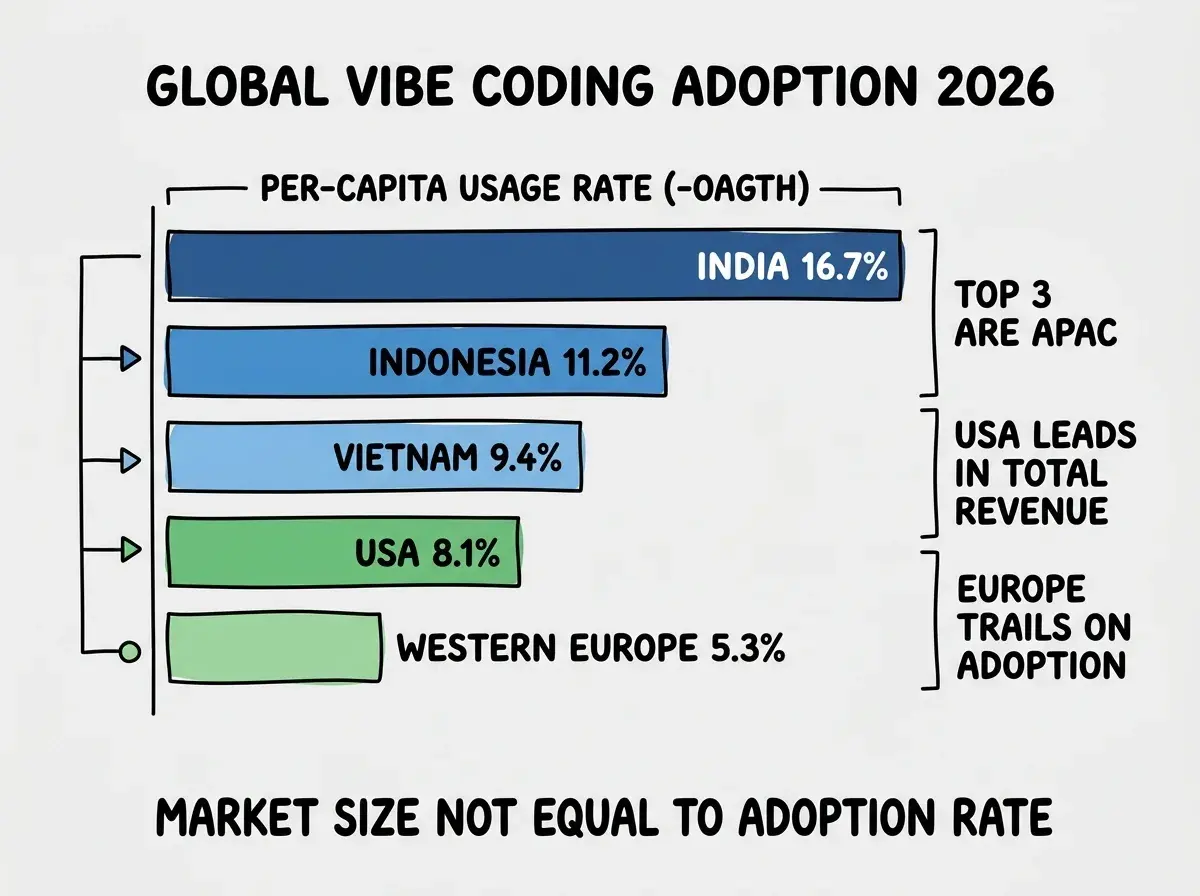
The US remains the largest market in absolute revenue terms because of higher per-developer pricing and larger enterprise contracts. But the per-capita usage rate is meaningfully behind APAC. This matters because adoption rate is the leading indicator of market direction, while revenue is the lagging one.
Western Europe lags both APAC and the US on adoption, with Germany and the UK noticeably slower than France, Spain, and the Nordics. The pattern correlates with regulatory caution around AI and a higher proportion of large enterprise codebases.
What This Means for Founders and Builders
The adoption distribution has practical implications for founders, hiring managers, and product teams. Three patterns matter most.
Talent supply. The deepest pool of AI-fluent developers in 2026 is in India, with Indonesia and Vietnam catching up fast. Founders building distributed teams have access to a substantially larger talent pool than they would have using only US-based hires.
Browse more analysis on AI development trends
Read more foundationsMarket entry timing. Products targeting developers should consider APAC as a primary market, not a localization afterthought. The willingness to pay for premium AI tools is rising fast in the region, and entering early establishes brand presence before US incumbents arrive.
Workflow patterns. Best practices for AI-assisted development are increasingly emerging from APAC engineering blogs and conferences. Western teams that only read US-centric content are missing innovations happening at scale elsewhere.
Where Growth Is Accelerating Next
The adoption story is not static. Three regions are growing fastest in late 2026 and are likely to reshape the rankings within 12 months.
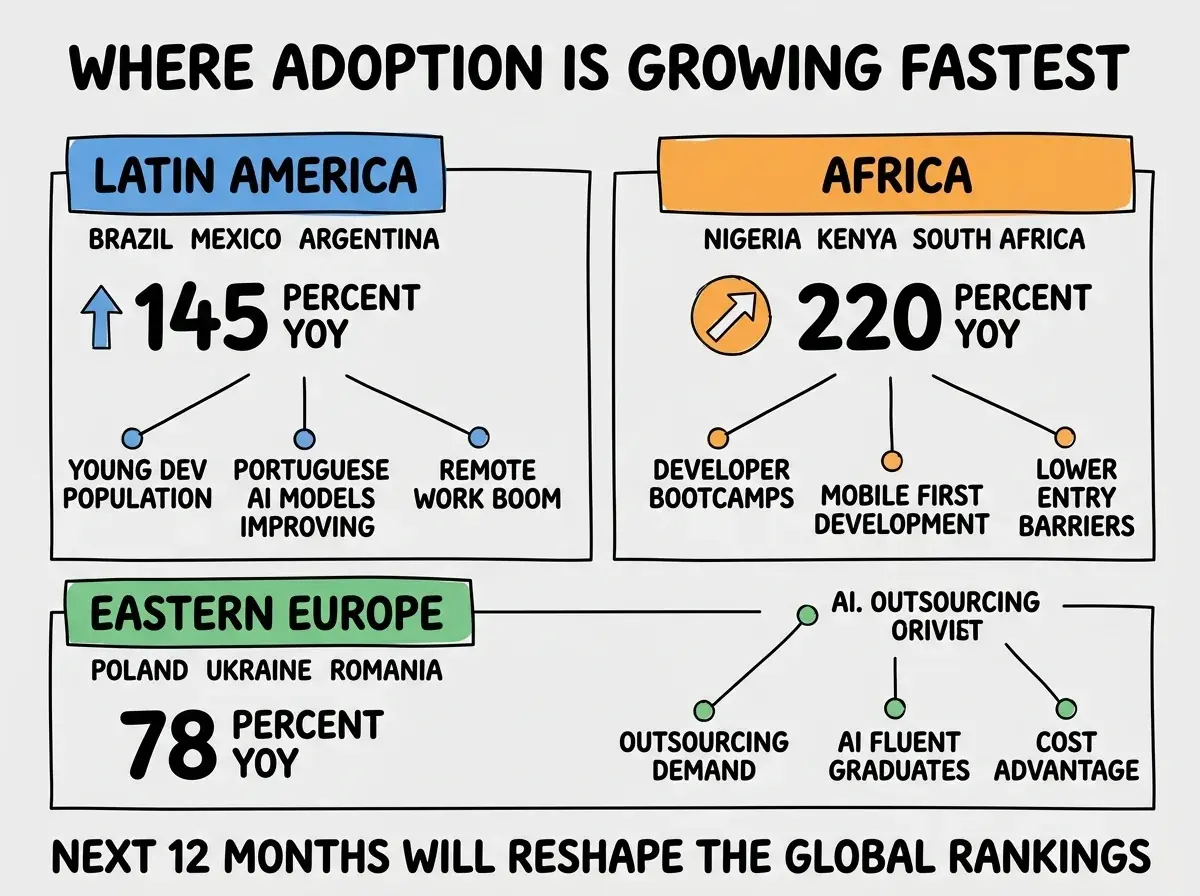
Latin America is growing at roughly 145 percent year over year, driven by Brazil, Mexico, and Argentina. Portuguese language model improvements have removed a major friction point, and the developer ecosystem is young enough to adopt fast.
Africa is growing at over 220 percent year over year, the fastest growth rate of any region. Nigeria, Kenya, and South Africa lead, and developer bootcamps are graduating cohorts of AI-fluent engineers in numbers that did not exist two years ago.
Eastern Europe is growing more slowly (around 78 percent year over year) but from a higher base. Poland, Ukraine, and Romania remain major outsourcing destinations and are increasingly the preferred locations for AI-augmented engineering teams serving Western clients.
The biggest mistake Western tech leaders make is assuming the US sets the global pace on AI tools. It does on revenue, not on adoption or on practice innovation. Teams that only read English-language US-centric content are systematically late to the workflow patterns emerging at scale in APAC and accelerating elsewhere. Subscribe to a few regional engineering blogs and conferences to catch the patterns earlier.
The other mistake is treating geographic adoption data as a competitive scoreboard. The point is not which region is "winning." The point is that the global pattern is uneven, and the unevenness creates real opportunities for founders, hiring teams, and product builders who pay attention to it.
A practical exercise is to look up your own region's adoption rate and compare it to the regional average. If your team is below the average, you have a clear hiring and training priority. If you are above, you have a leverage point worth turning into either a marketing differentiator or a hiring magnet for the next cohort. Either way, knowing your position relative to the regional baseline is a five-minute exercise that produces a clearer roadmap than most strategic planning sessions.
The geographic story also has interesting implications for product design. Tools that worked well in US markets in 2024 are increasingly being challenged by APAC-built alternatives that better fit regional workflows. Founders who only design for the US may find their market shrinking faster than they expect, while founders who design for APAC primary use cases may find their addressable market larger than the US-only competition realizes. The next several years of vibe coding will likely see at least one major category leader emerge from APAC rather than from the US, and the structural advantages favor the region that adopted earliest.
A final note on the data: most of the figures cited in this piece come from public surveys (Stack Overflow, GitHub, JetBrains) and from analysis pieces that aggregate them. The numbers will continue to shift through 2027 as adoption accelerates in newer markets and the relative growth rates change. Treat any specific percentage as a rough guide rather than a precise measurement, and update your assumptions quarterly based on the latest survey releases.
What This Means For You
Geographic adoption patterns are easy to ignore and high-leverage to track. The teams that understand them make better hiring, market entry, and tooling decisions than the teams that do not.
- If you're a founder: Consider APAC for your engineering team and Latin America or Africa for your next product market. Both decisions are unconventional in 2026 and likely to look obvious in 2028.
- If you're changing careers: AI-assisted development skills are most in demand in regions you may not have considered. Remote-friendly companies are increasingly hiring globally for these skills.
- If you're a student: Follow developer ecosystems outside your home region. The patterns and tools you learn from them give you an edge over peers who stay local.
Browse more analysis on AI development trends
Read more foundations